🏗 Architecture
About the Project
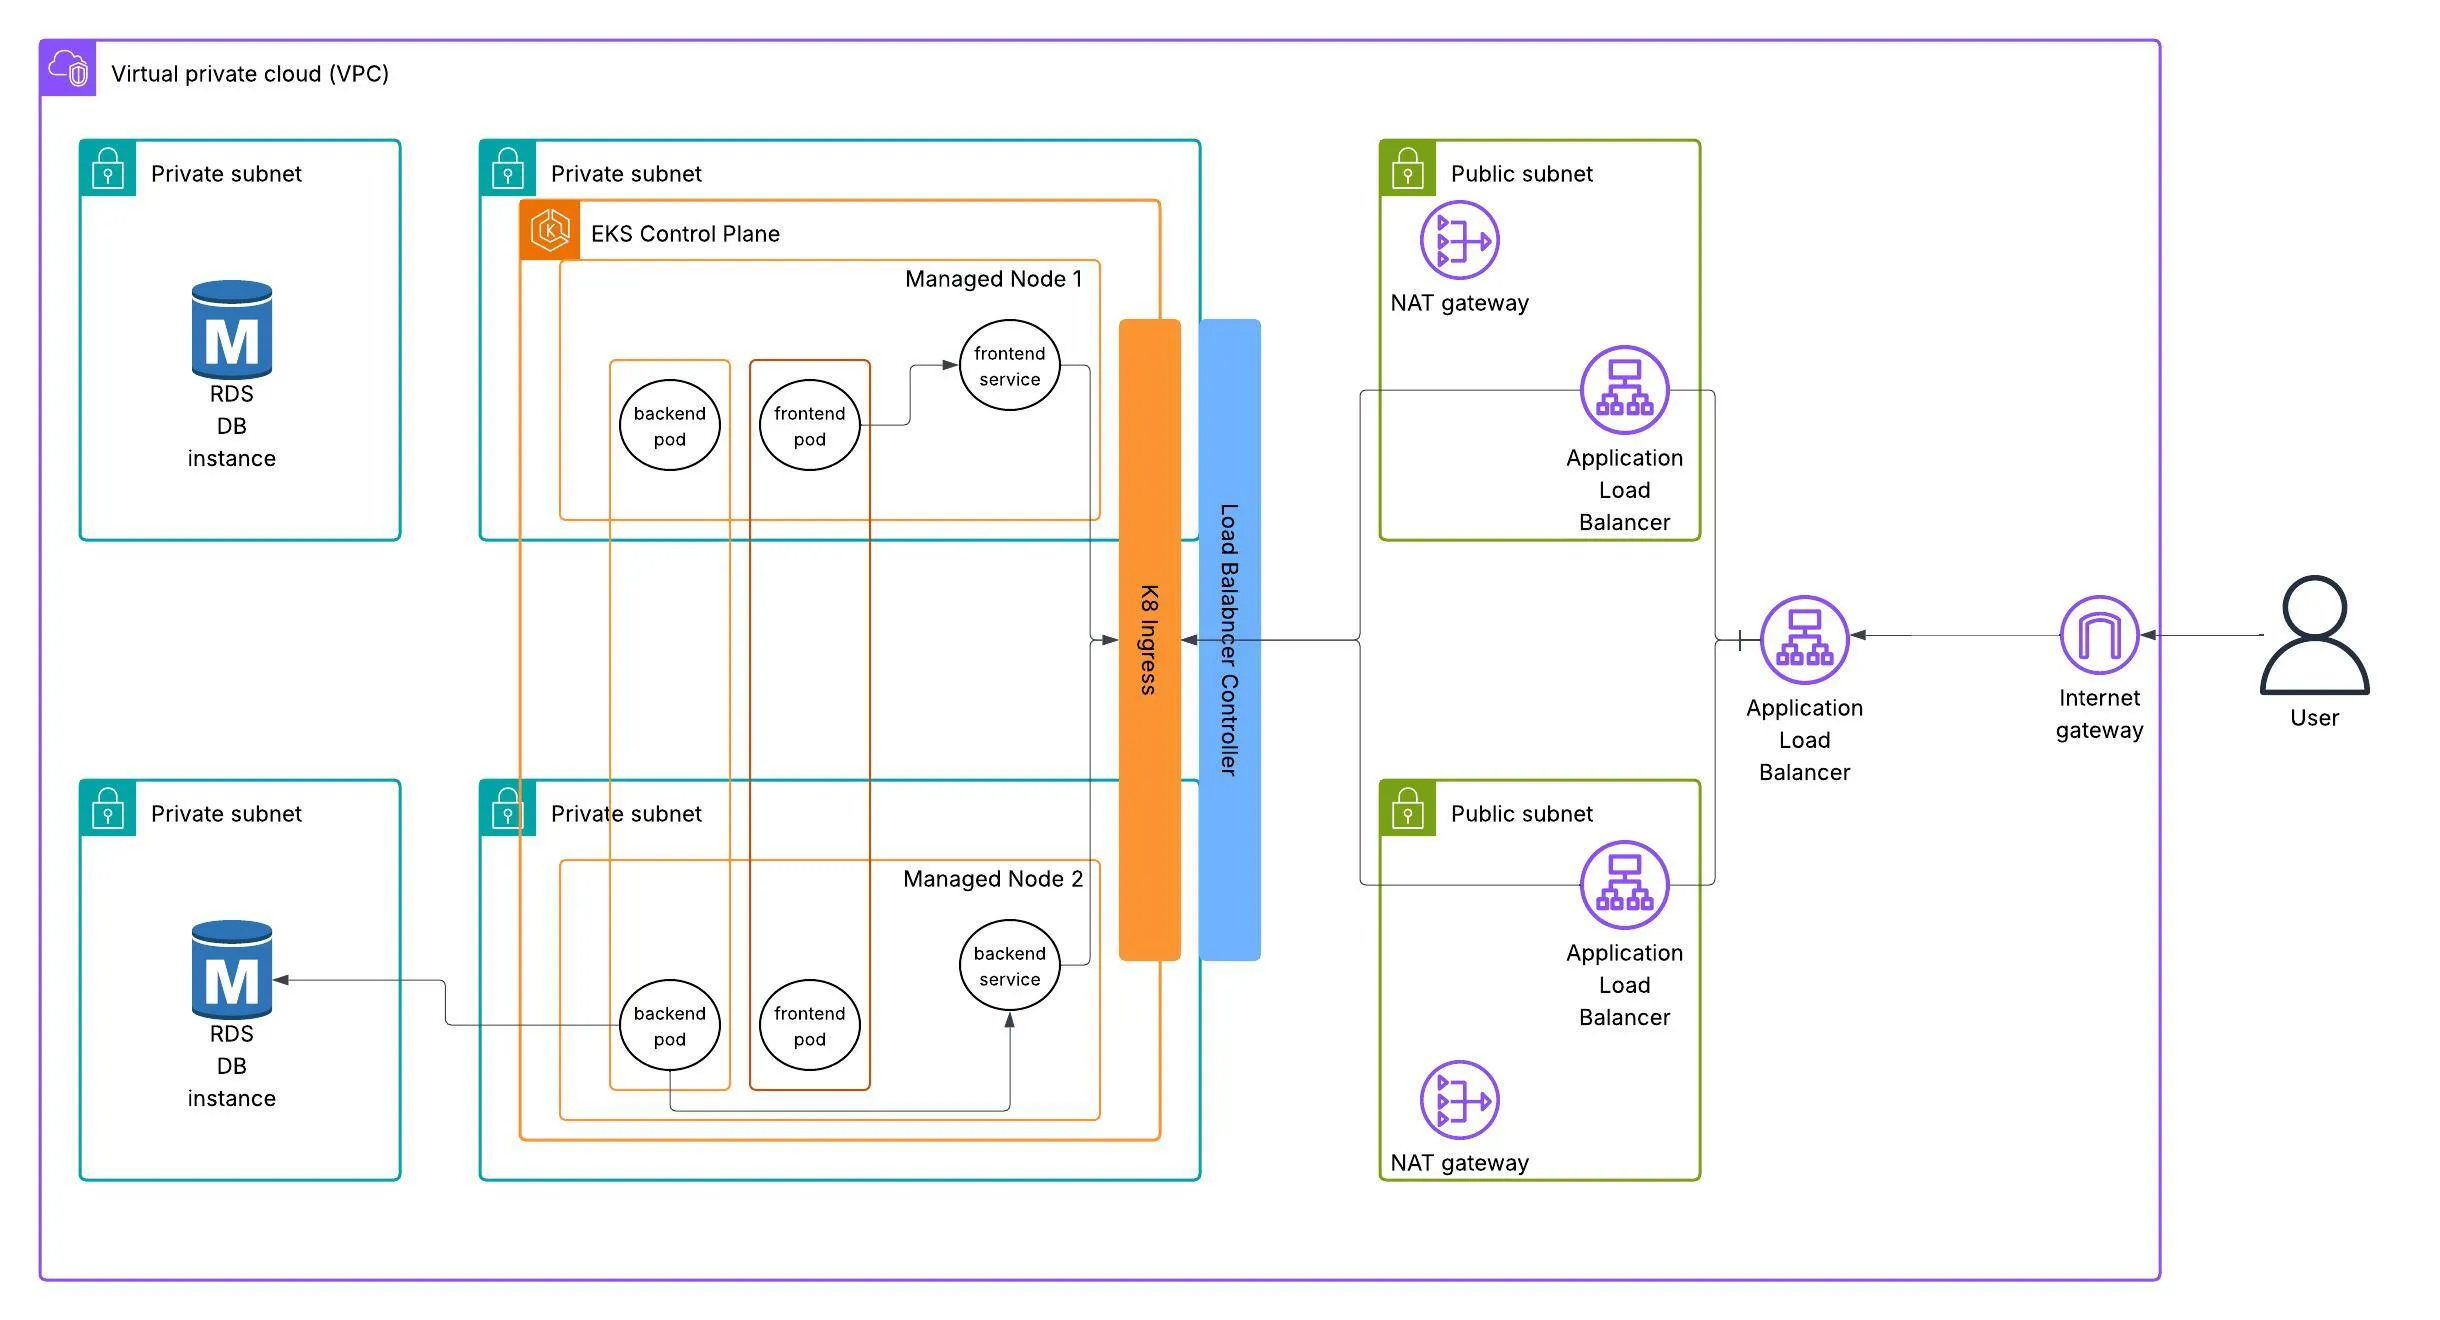
In this project, we will deploy a three-tier application on AWS EKS (Elastic Kubernetes Service). The application consists of a React frontend, Flask backend and an RDS PostgreSQL database. We will use Docker to containerise the application, Github Actions and ECR to store the frontend and backend images. ArgoCD for CI/CD and Kubernetes to orchestrate the deployment on EKS. For monitoring and observability, we will use Prometheus and Grafana.
To make the application publicly accessible, I’ll implement an AWS load balancer controller which will provision an ALB (Application Load Balancer) through Kubernetes ingress resources.
In addition Kubernetes secrets will be used to store sensitive information such as database credentials and ConfigMap will be used to store non-sensitive configuration data.
Before deploying the backend service, I’ll run a database migration using a Kubernetes Job, ensuring the schema is properly initialized. To simplify database connectivity, I’ll utilize an External Service for the RDS instance, leveraging Kubernetes’ DNS-based service discovery to maintain clean application configuration.
⚠️ NOTE: (EKS charges .10p/hour so ensure it’s deleted when you complete project) I’VE WARNED YOU :D
The reason why we are using Kubernetes is because its a powerful, popular tool for running large-scale, containerized applications or microservices. Its a must in the DevOps world and is used by many companies to manage their applications in production. Kubernetes provides features like automatic scaling, load balancing, and self-healing, making it easier to deploy and manage applications in a cloud environment.
Setting up Kubernetes on AWS can be complex, but using EKS simplifies the process by providing a managed Kubernetes service. EKS handles the underlying infrastructure, allowing us to focus on deploying and managing our applications without worrying about the complexities of setting up and maintaining a Kubernetes cluster from scratch.
In EKS, youre provided with 3 options on how to run your workloads:
- Managed Node Groups: EKS automatically provisions and manages the EC2 instances that run your Kubernetes workloads. This is the most common and recommended option for running workloads on EKS.
- Self-Managed Node Groups: You can create and manage your own EC2 instances to run your Kubernetes workloads. This option gives you more control over the underlying infrastructure but requires more management overhead.
- Fargate Nodes: EKS Fargate allows you to run your Kubernetes workloads without managing the underlying EC2 instances. Fargate automatically provisions and scales the compute resources needed to run your containers, making it a serverless option for running workloads on EKS. Note: You cant use persistent volumes with Fargate, so if you need to store data that persists beyond the lifecycle of a pod, you should use managed node groups or self-managed node groups.
We will keep it simple and use Managed Node Groups for this project.
Prerequisites
I’ll assume you have basic knowledge of Docker, Kubernetes, and AWS services. You will need to install eksctl, aws cli, kubectl and docker on your local machine.
You will also need an AWS account with the necessary permissions to create EKS clusters, EC2 instances, and other resources.
🚀 Creating the EKS Cluster
⚠️ NOTE: For each section I will actually recommend reseraching each command you input to understand what it does and why its needed. This will help you understand the process better and make it easier to troubleshoot any issues that may arise. Use documentation then AI as long as you understand what its doing and why its needed.
⚠️ NOTE (Remember to configure your AWS CLI, you can clone the repo and any files modify to suit your needs)
Lets start by setting up the EKS cluster and deploying the application. To create the EKS cluster, we will use eksctl, a command-line tool that simplifies the process of creating and managing EKS clusters.
We will use a cluster-config.yaml file to define the cluster configuration. It makes a reusable template for the cluster configuration.
run eksctl create cluster -f cluster-config.yaml in terminal.
apiVersion: eksctl.io/v1alpha5
kind: ClusterConfig

metadata:
  name: three-tier
  region: eu-west-2
  version: "1.31"

managedNodeGroups:
  - name: standard-workers
    instanceType: t3.medium
    minSize: 1
    maxSize: 3
    desiredCapacity: 2
    # This automatically adds the necessary IAM policies to be attached to the nodes
    iam:
      withAddonPolicies:
        imageBuilder: true
        albIngress: true
        cloudWatch: true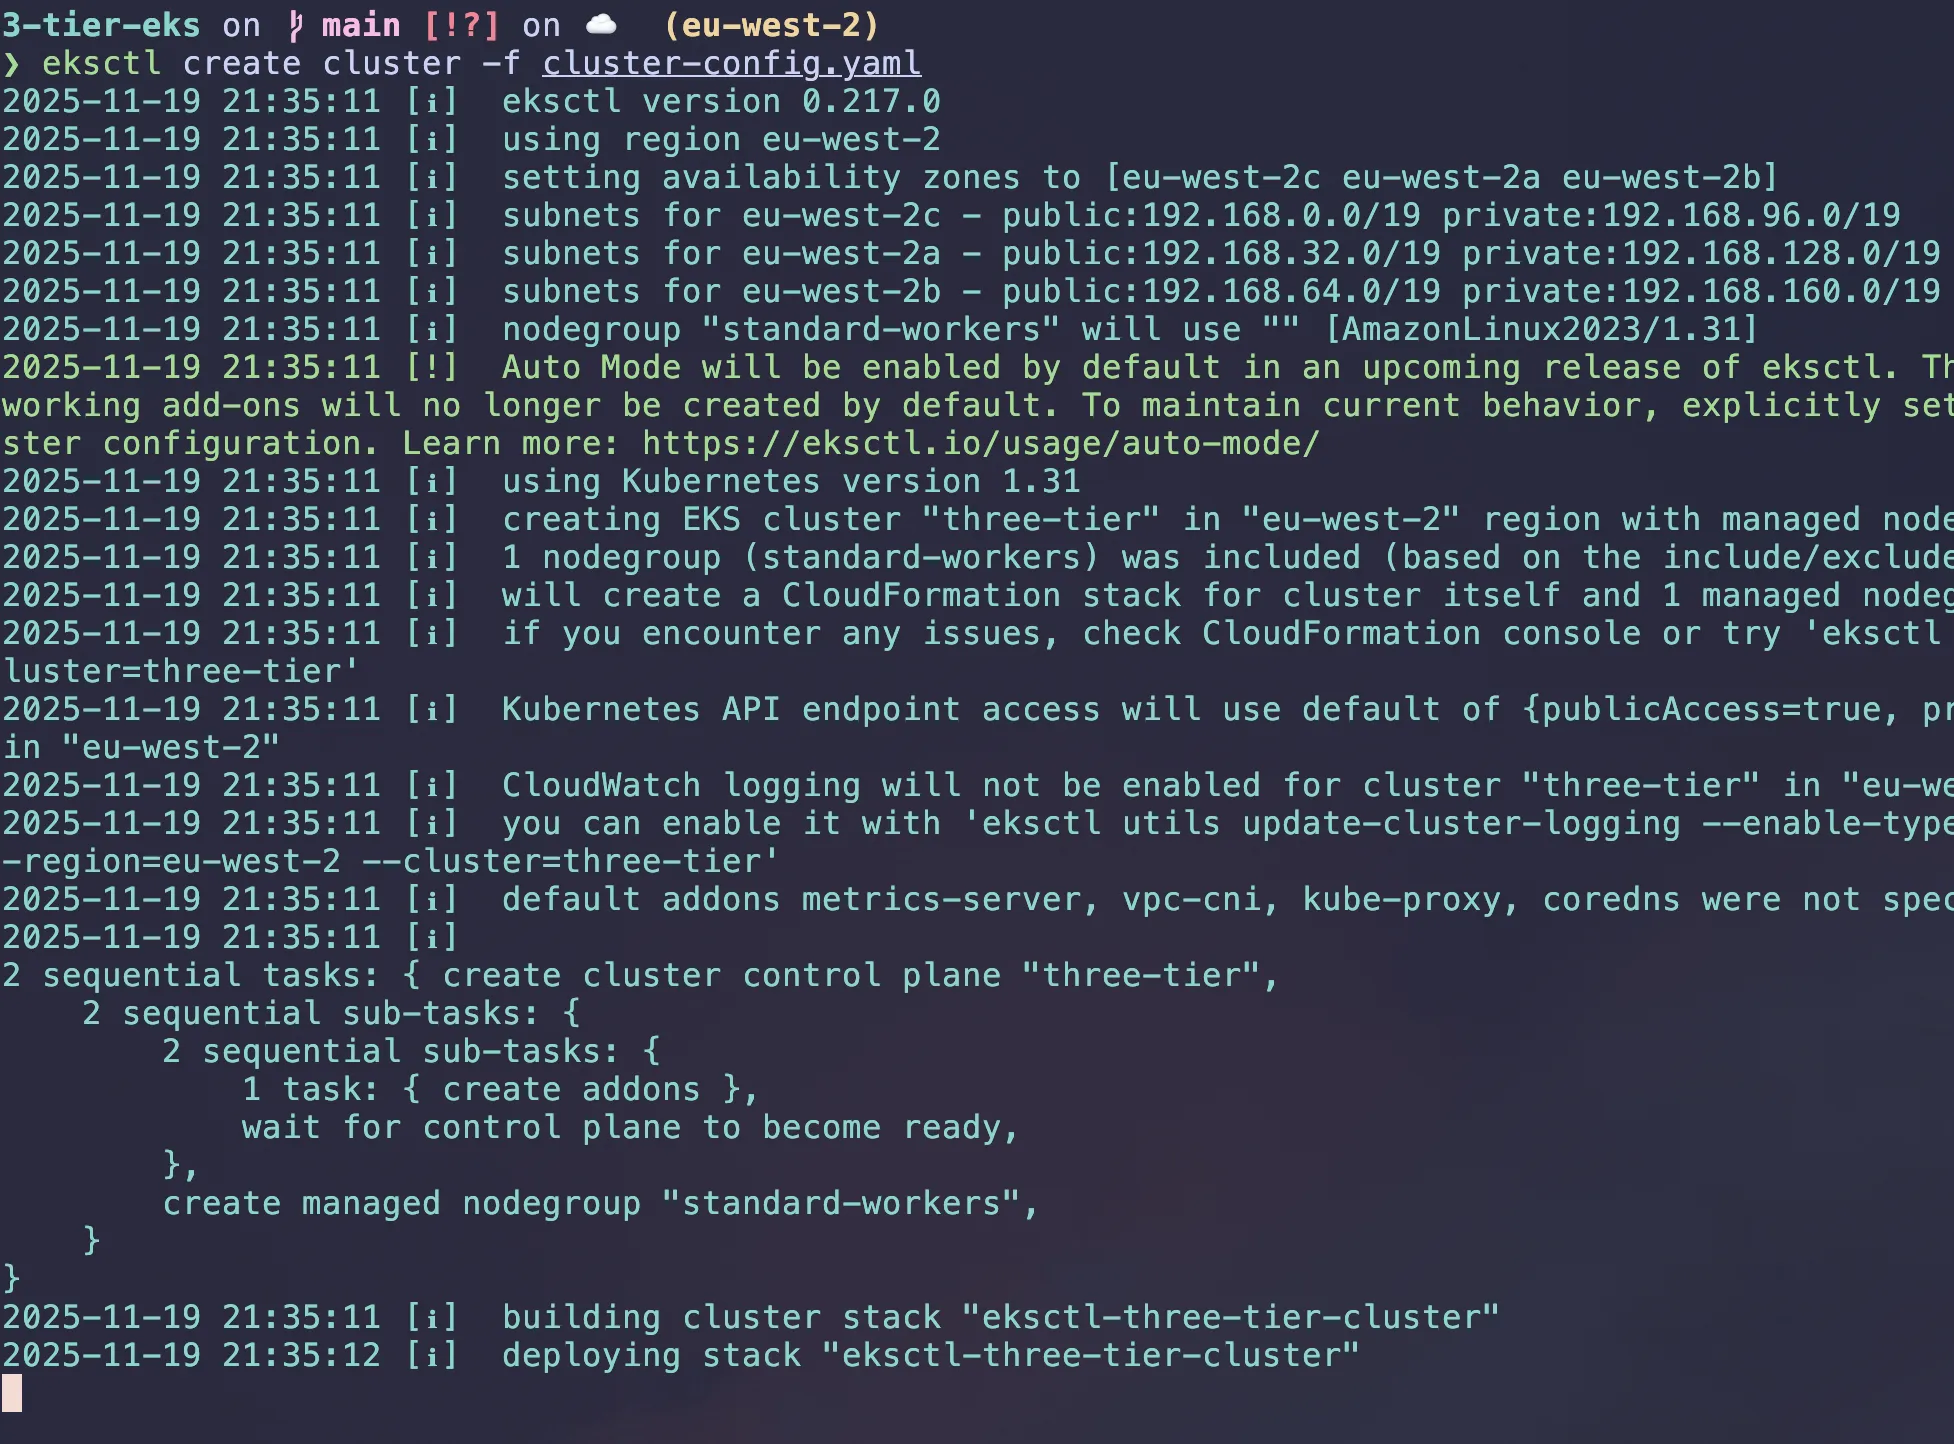
A cloud formation stack is what runs in the backend to configure these resources.
The iam part in the code is a shortcut in eksctl. It automatically attaches extra AWS permissions (IAM Policies) to your Worker Nodes (the EC2 instances running your pods).
albIngress: true- It attaches the IAM policy required by the AWS Load Balancer Controller directly to your worker nodes. (It helps manually attaching IAM role, setting up OIDC, needing to create Kubernetes service account).cloudWatch: true- It attaches the CloudWatchAgentServerPolicy to your nodes.imageBuilder: true- It attaches the Full Access policy for ECR (AmazonEC2ContainerRegistryFullAccess) to your nodes.
It can take 10-20 minutes to create the cluster, so be patient.
Once the cluster is created, you can verify it by running:
# Check the status of the EKS cluster
aws eks list-clusters
kubectl command should be automatically configured by eksctl. Run these commands to ensure you can see the nodes in your cluster:
# Check the nodes in the cluster
kubectl get namespaces #list all namespaces
kubectl get nodes #list all nodes
kubectl get pods -A #list all pods in all namespaces
kubectl get services -A #list all services in all namespaces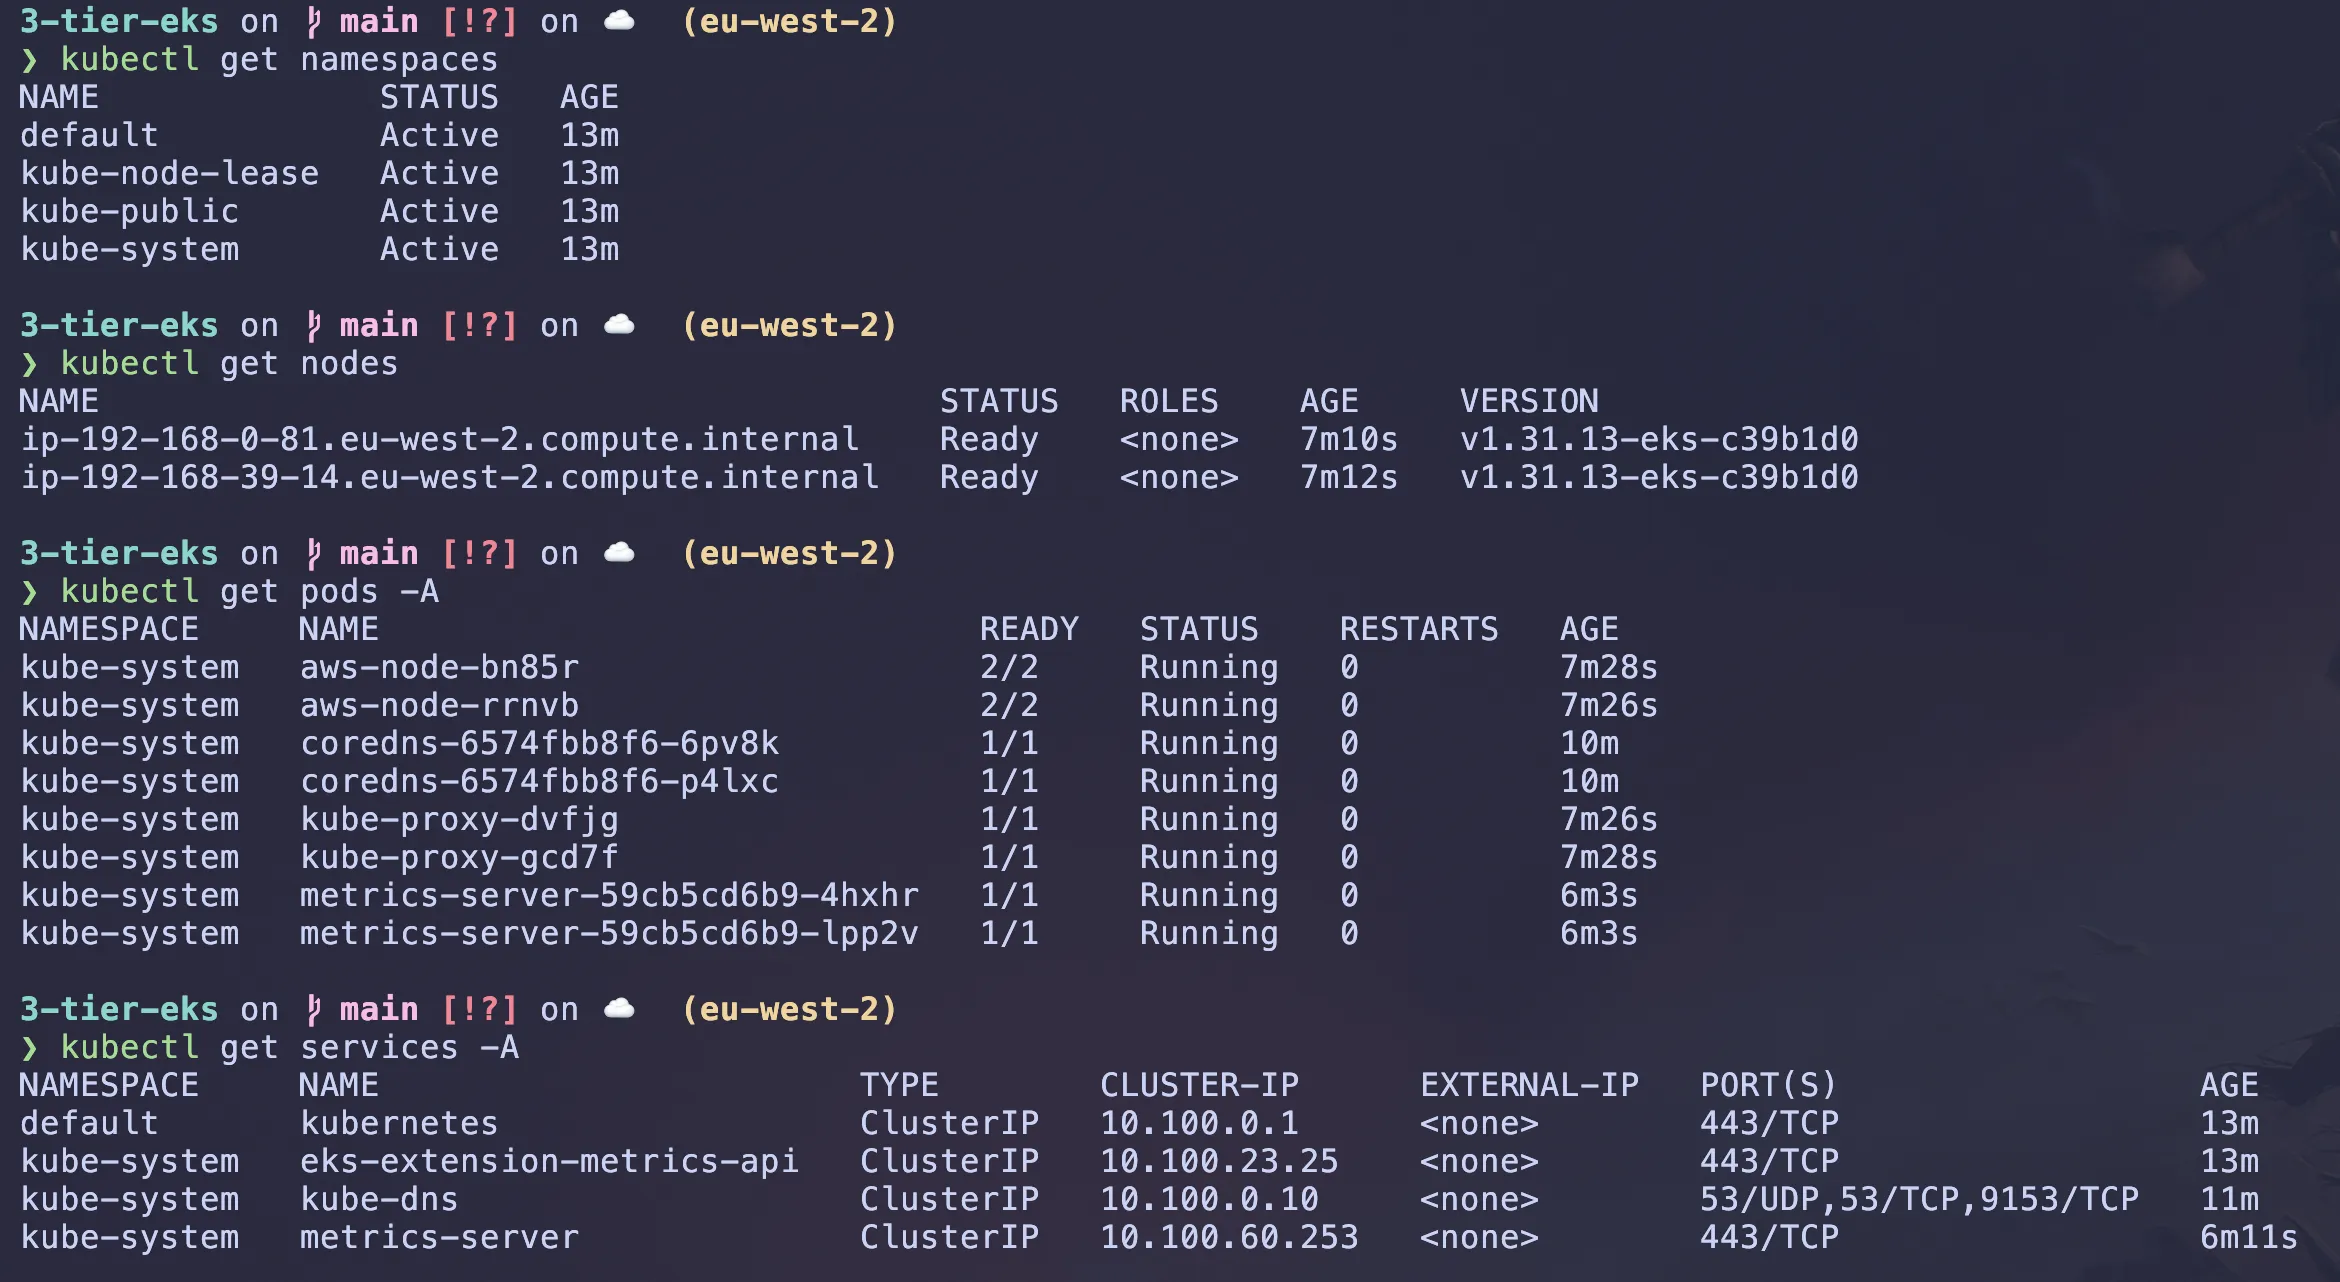
Hopefully should all be up and running.
For this project we are using a React frontend, a Flask backend that connects to a PostgreSQL database.
Creating PostgreSQL RDS Database
The PostgreSQL RDS instance will be in the same VPC as the EKS cluster, allowing the application to connect to it securely. EKS created private subnets for the cluster, so we will use those subnets to deploy the RDS instance.
Lets set some variables to create our RDS instance in terminal
# customise these how you want (run in terminal to set them)
CLUSTER_NAME="three-tier"
REGION="eu-west-2"
DB_NAME="threetierreactdb"
DB_SUBNET_GROUP_NAME="three-tier-subnet-group"

# Lets also securely store the DB password (after command: enter password)
read -s DB_PASSWORD

# Lets get network details automatically
# Get the VPC ID for the EKS cluster
VPC_ID=$(aws eks describe-cluster \
  --name $CLUSTER_NAME \
  --region $REGION \
  --query "cluster.resourcesVpcConfig.vpcId" \
  --output text)

# Get the Private Subnet IDs for the EKS cluster (eksctl tags private subnets with 'InternalELB')
SUBNET_IDS=$(aws ec2 describe-subnets \
  --filters "Name=vpc-id,Values=$VPC_ID" \
  "Name=tag:kubernetes.io/role/internal-elb,Values=1" \
  --query "Subnets[].SubnetId" \
  --region $REGION \
  --output text)

# create a subnet group for the RDS instance
# (I had an issue with extracting the subnet IDs so i had to manually entered them)
aws rds create-db-subnet-group \
  --db-subnet-group-name $DB_SUBNET_GROUP_NAME \
  --db-subnet-group-description "Subnet group for three-tier RDS instance" \
  --subnet-ids $SUBNET_IDS \  # if you get an error manually enter the subnet ids from echo "$SUBNET_IDS"
  --region $REGION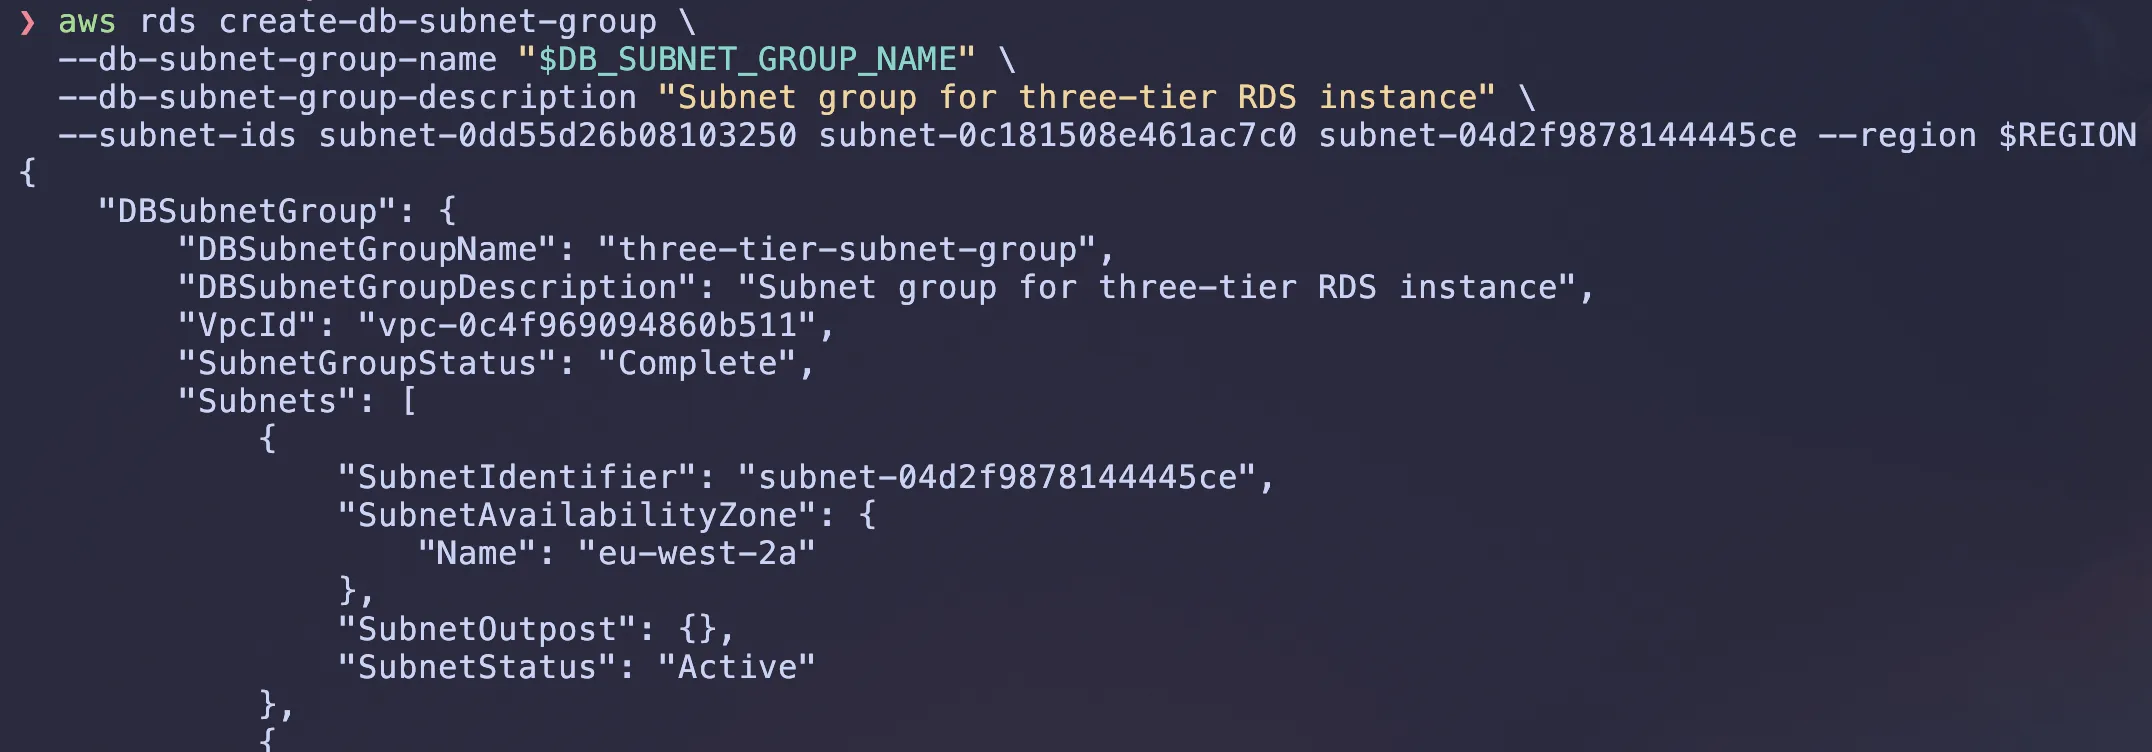
Lets create a security group for the RDS instance. This security group will allow inbound traffic from the EKS cluster’s worker nodes on the PostgreSQL port (5432).
# Get the Security Group ID of the EKS Nodes (This is where your app runs)
# eksctl creates a shared SG for all nodes, we need to allow this one.
EKS_NODE_SG_ID=$(aws ec2 describe-security-groups \
  --filters "Name=vpc-id,Values=$VPC_ID" "Name=tag:aws:eks:cluster-name,Values=$CLUSTER_NAME" \
  --query "SecurityGroups[0].GroupId" \
  --region $REGION \
  --output text)
# Create a security group for the RDS instance to allow inbound traffic from the EKS cluster's worker nodes on the PostgreSQL port (5432).
RDS_SG_ID=$(aws ec2 create-security-group \
  --group-name "rds-security-group" \
  --description "Security group for RDS instance three-tier" \
  --vpc-id $VPC_ID \
  --region $REGION \
  --query "GroupId" \
  --output text)

# Allow traffic ONLY from the EKS Node Group on port 5432
aws ec2 authorize-security-group-ingress \
  --group-id $RDS_SG_ID \
  --protocol tcp \
  --port 5432 \
  --source-group $EKS_NODE_SG_ID \
  --region $REGION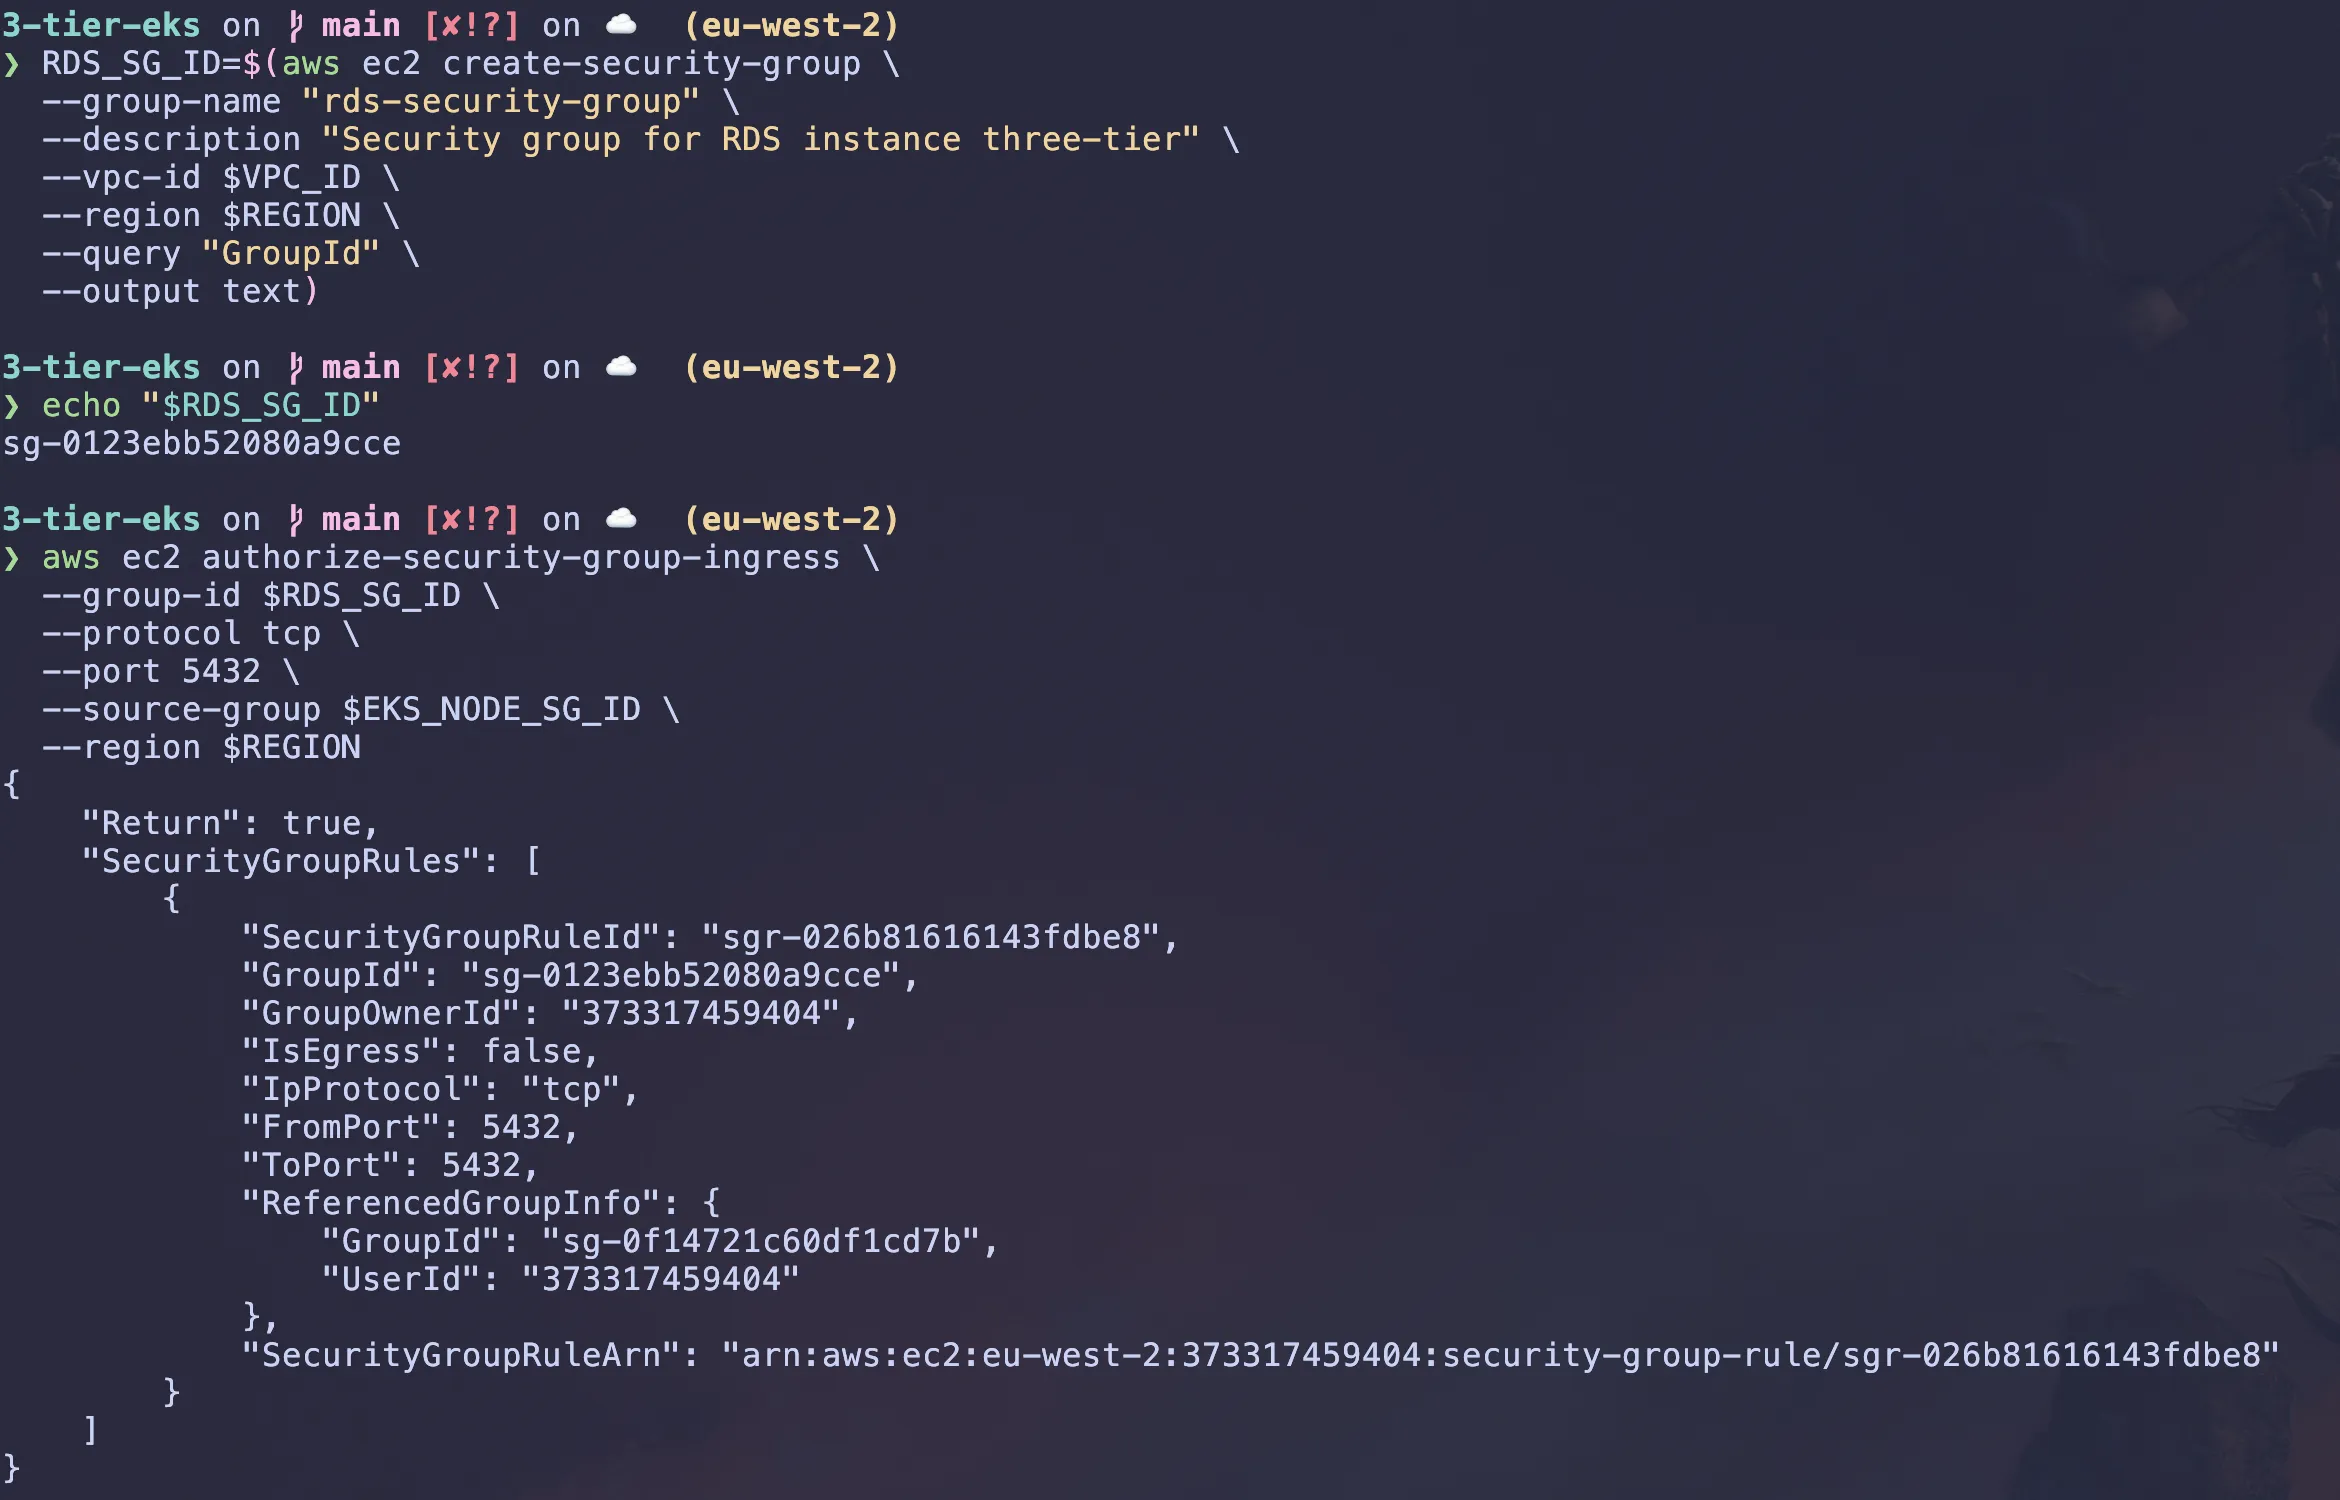
Now to create the RDS instance, we will use the aws rds create-db-instance command. This command will create a PostgreSQL database instance in the VPC and private subnets with the security group we created earlier.
aws rds create-db-instance \
  --db-instance-identifier $DB_NAME \
  --db-instance-class db.t3.micro \
  --engine postgres \
  --engine-version 15 \
  --master-username postgresadmin \
  --master-user-password $DB_PASSWORD \
  --allocated-storage 20 \
  --vpc-security-group-ids $RDS_SG_ID \
  --db-subnet-group-name $DB_SUBNET_GROUP_NAME \
  --no-publicly-accessible \
  --backup-retention-period 7 \
  --multi-az \
  --storage-type gp2 \
  --region $REGION
For security: Storing secrets like the DB password in AWS Secrets Manager or a Kubernetes Secret instead of hardcoding them would be recommended.
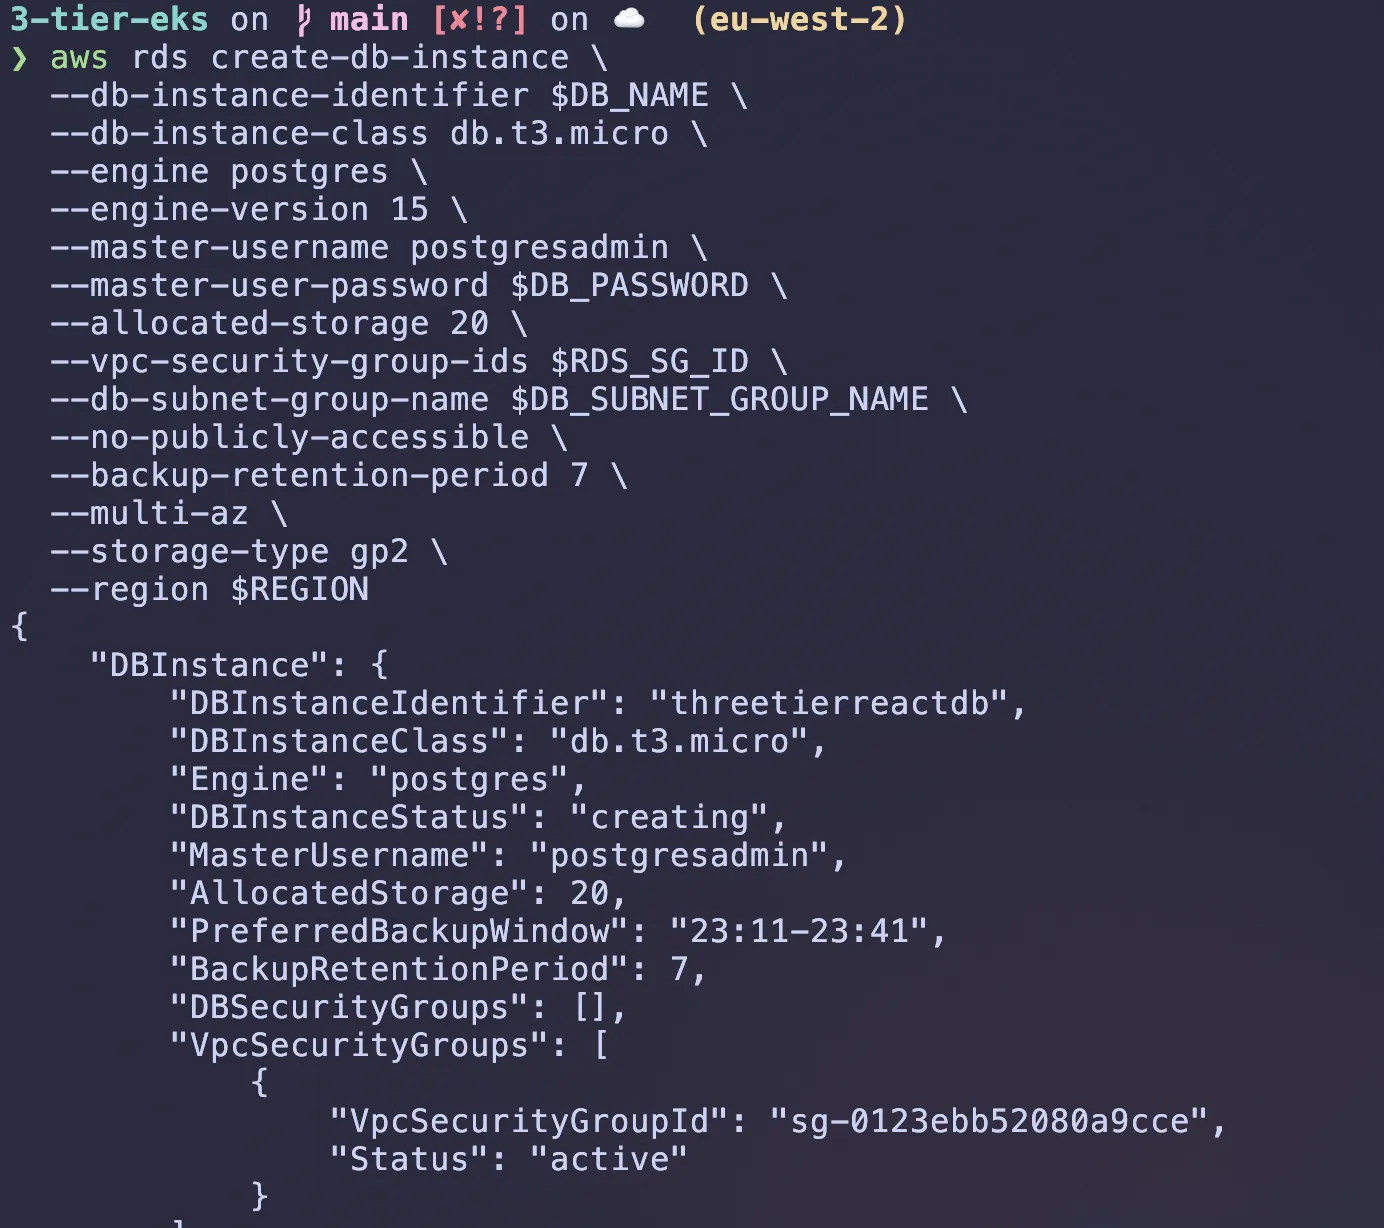
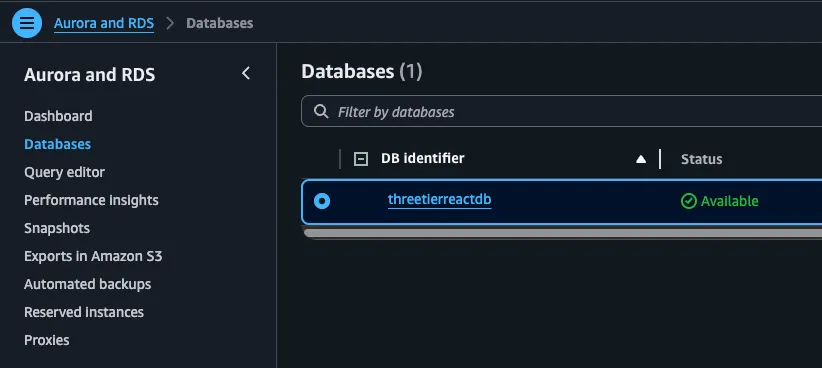
It may take a while but you will see it getting created, go to AWS RDS Console and check the status of the DB instance.
GitHub Actions & ECR setup
You can clone this repository to get the code for the application:
git clone https://github.com/wegoagain-dev/3-tier-eks.gitBefore we begin lets set up OIDC for the connection between our AWS and GitHub Actions. This allows our GitHub Actions workflow to authenticate with AWS using short-lived tokens, completely removing the need to store any AWS keys in GitHub secrets.
1. Create the OIDC Provider for GitHub (If it doesn’t exist)
AWS creates this once per account, but it’s good to check.
aws iam create-open-id-connect-provider \
  --url https://token.actions.githubusercontent.com \
  --client-id-list sts.amazonaws.com \
  --thumbprint-list 6938fd4d98bab03faadb97b34396831e3780aea1
2. Create the Trust Policy (The “Rules” for who can enter)
This ensures ONLY the specific repo can use this role.
get your $AWS_ACCOUNT_ID using AWS_ACCOUNT_ID=$(aws sts get-caller-identity --query Account --output text)
dont forget to change the repo name to match your own
cat > trust-policy.json <<EOF
{
  "Version": "2012-10-17",
  "Statement": [
    {
      "Effect": "Allow",
      "Principal": {
        "Federated": "arn:aws:iam::${AWS_ACCOUNT_ID}:oidc-provider/token.actions.githubusercontent.com"
      },
      "Action": "sts:AssumeRoleWithWebIdentity",
      "Condition": {
        "StringEquals": {
          "token.actions.githubusercontent.com:aud": "sts.amazonaws.com"
        },
        "StringLike": {
          "token.actions.githubusercontent.com:sub": "repo:wegoagain-dev/3-tier-eks:*"
        }
      }
    }
  ]
}
EOF
3. Create the Role and Attach Permissions
aws iam create-role --role-name GitHubActionsECR --assume-role-policy-document file://trust-policy.json

aws iam attach-role-policy --role-name GitHubActionsECR --policy-arn arn:aws:iam::aws:policy/AmazonEC2ContainerRegistryPowerUser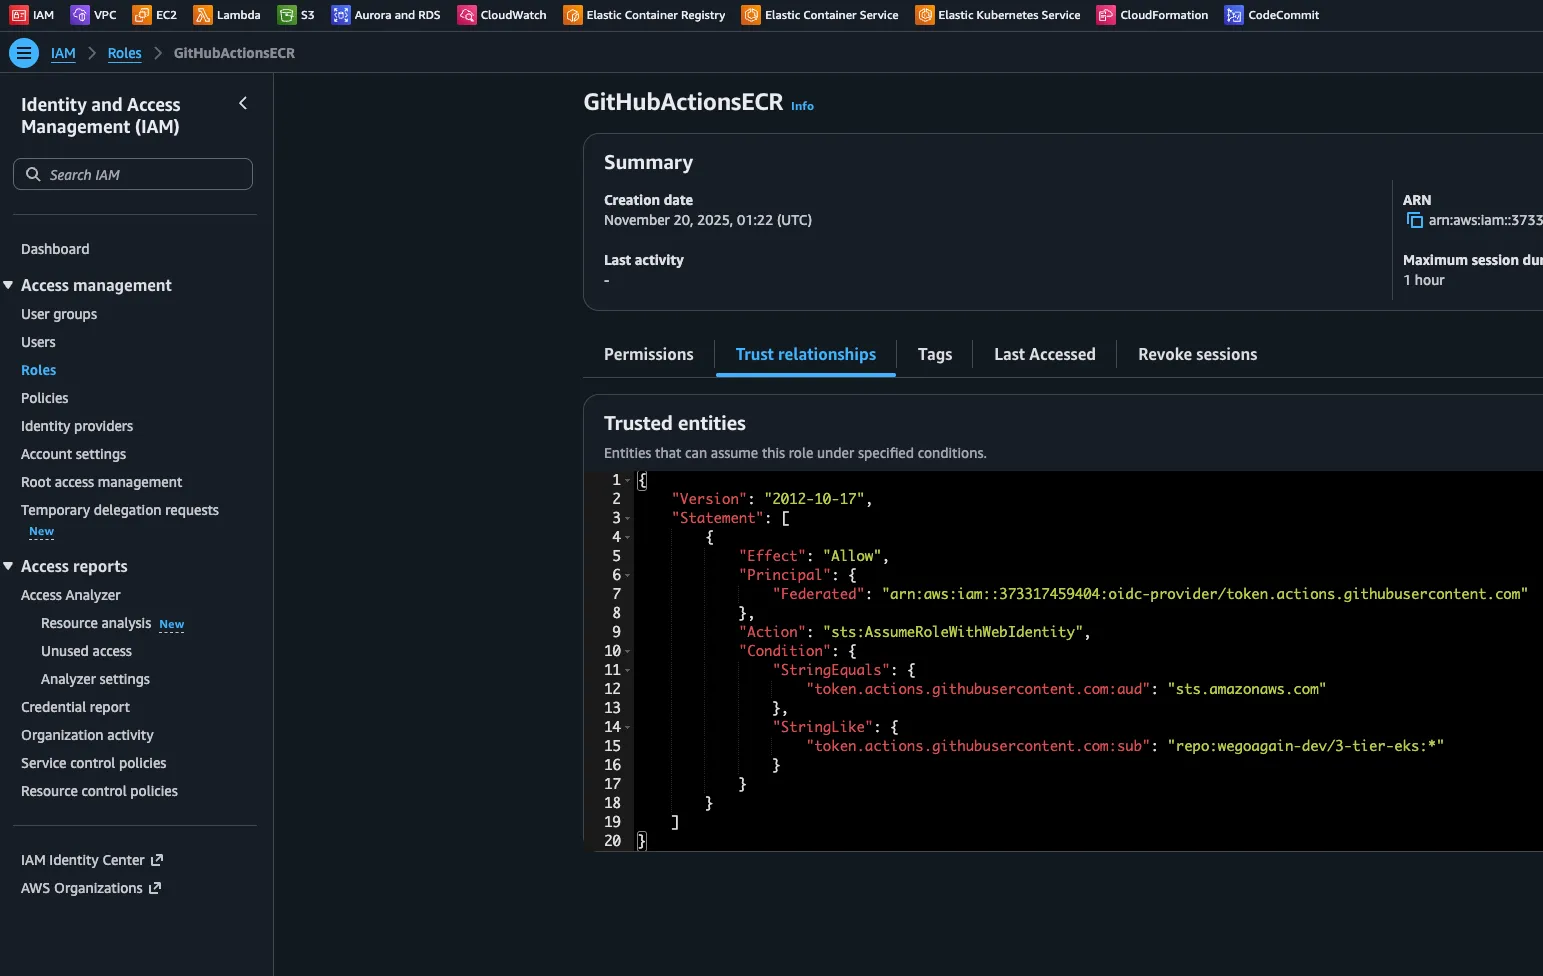

Now we have the permissions we will need to create the ECR repository for these images to be pushed to.
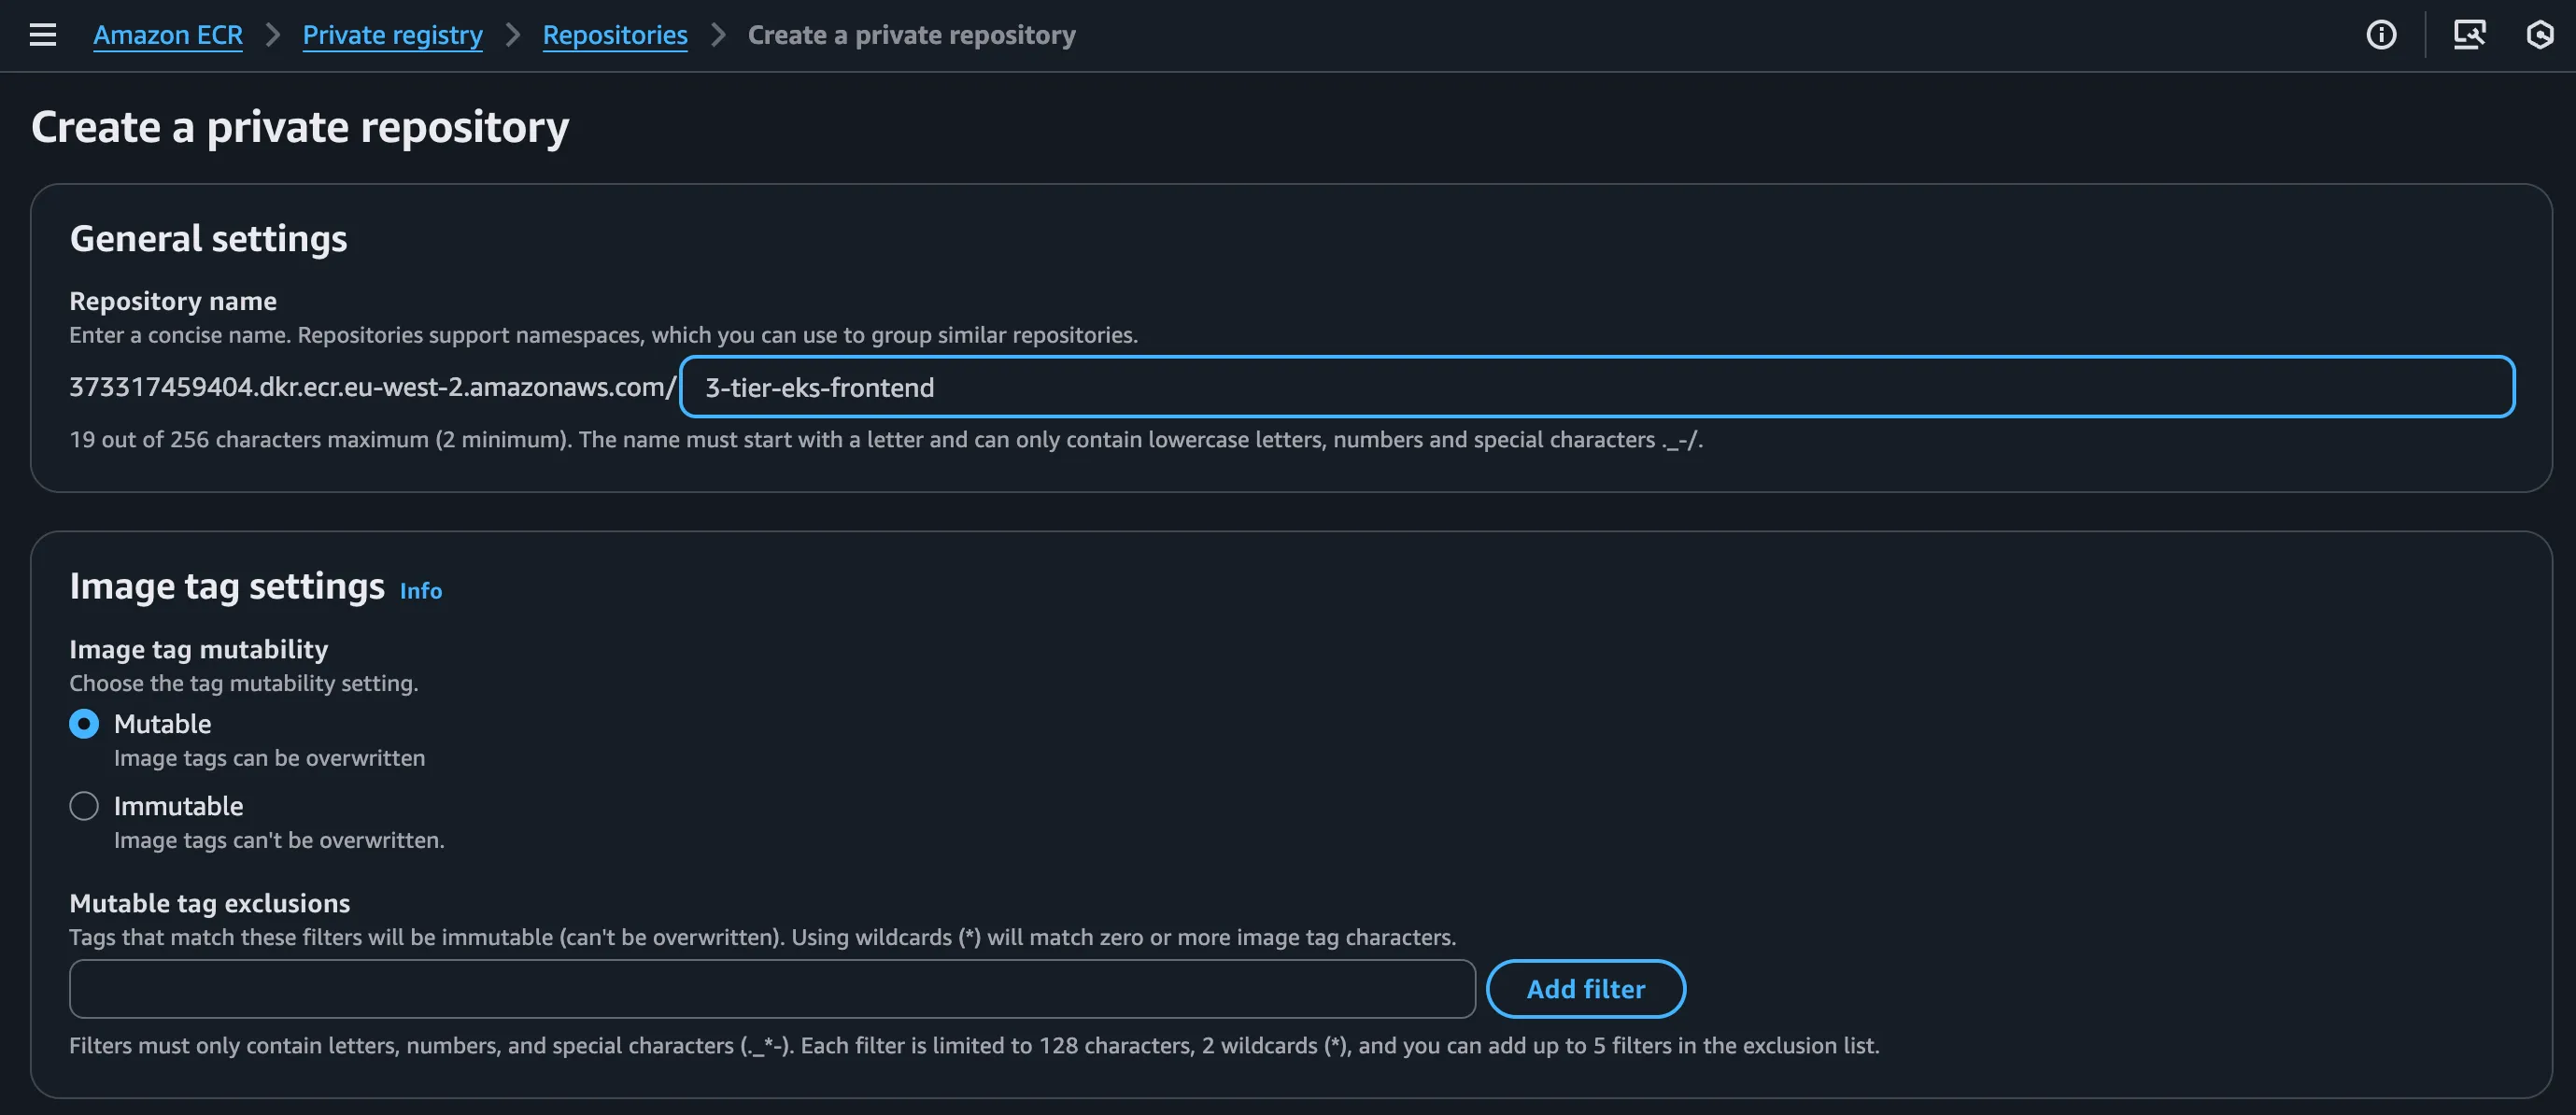
- Go to ECR on AWS console and create a new frontend repository we will be pushing to ECR.
- Do the same for the backend repository.
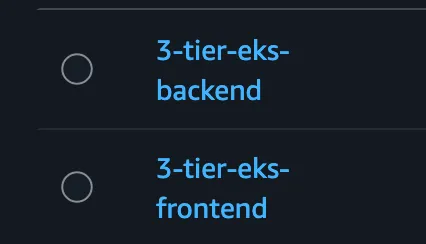
Now this repository will have it but we will create this following folder .github/workflows/ci.yml. This will contain the CI pipeline for the application. It will push our images to the ECR.
Use the following ci.yml file and replace the following with your own:
AWS_REGION: The AWS region where your ECR repositories are located (e.g., us-west-2).
ECR_REPOSITORY_FRONTEND: The name of the ECR repository you created for your frontend image.
ECR_REPOSITORY_BACKEND: The name of the ECR repository for your backend image.
IAM_ROLE_ARN: The full ARN of the IAM role you just created. It will look like
arn:aws:iam::123456789012:role/YourRoleName.
Now do a git commit and push your changes to the main branch and tests should run successfully and images should show on ECR.
git add .
git commit -m "Added CI pipeline"
git push
Kubernetes deployment
Everything we will be deploying is in the k8s folder in the repository. ( I recommend understanding the files and how they work)
Namespace
The first thing we will be doing is creating the Kubernetes namespace, we do this to isolate group of resources within a cluster. It gives you a virtual cluster for you to work within, usually needed when working in teams helps avoid conflicts and manage resources more efficiently.
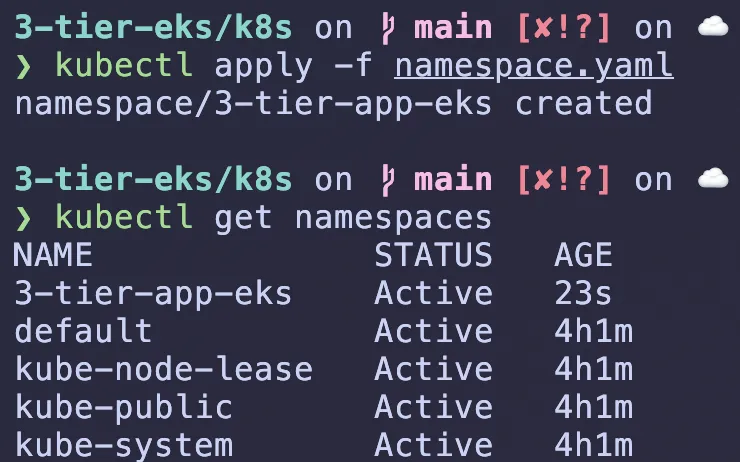
ensure youre in the k8s folder and do kubectl apply -f namespace.yaml will create the namespace named 3-tier-app-eks for the application. if you do kubectl get namespaces you should see the namespace created.
RDS service
Time to create a service for our RDS instance
Modify the database-service.yaml file and enter your RDS endpoint in the externalName field. You can find your RDS endpoint in the AWS console in the one we created under the RDS instance details. Then apply the service manifest: kubectl apply -f database-service.yaml
apiVersion: v1
kind: Service
metadata:
  name: postgres-db
  namespace: 3-tier-app-eks
  labels:
    service: database
spec:
  type: ExternalName
  externalName: <your-rds-endpoint>
  ports:
  - port: 5432
This Kubernetes manifest tells any application running inside your Kubernetes cluster (specifically in the 3-tier-app-eks namespace) that if it wants to connect to a database named postgres-db on port 5432, it should actually connect to the external Amazon RDS instance located at
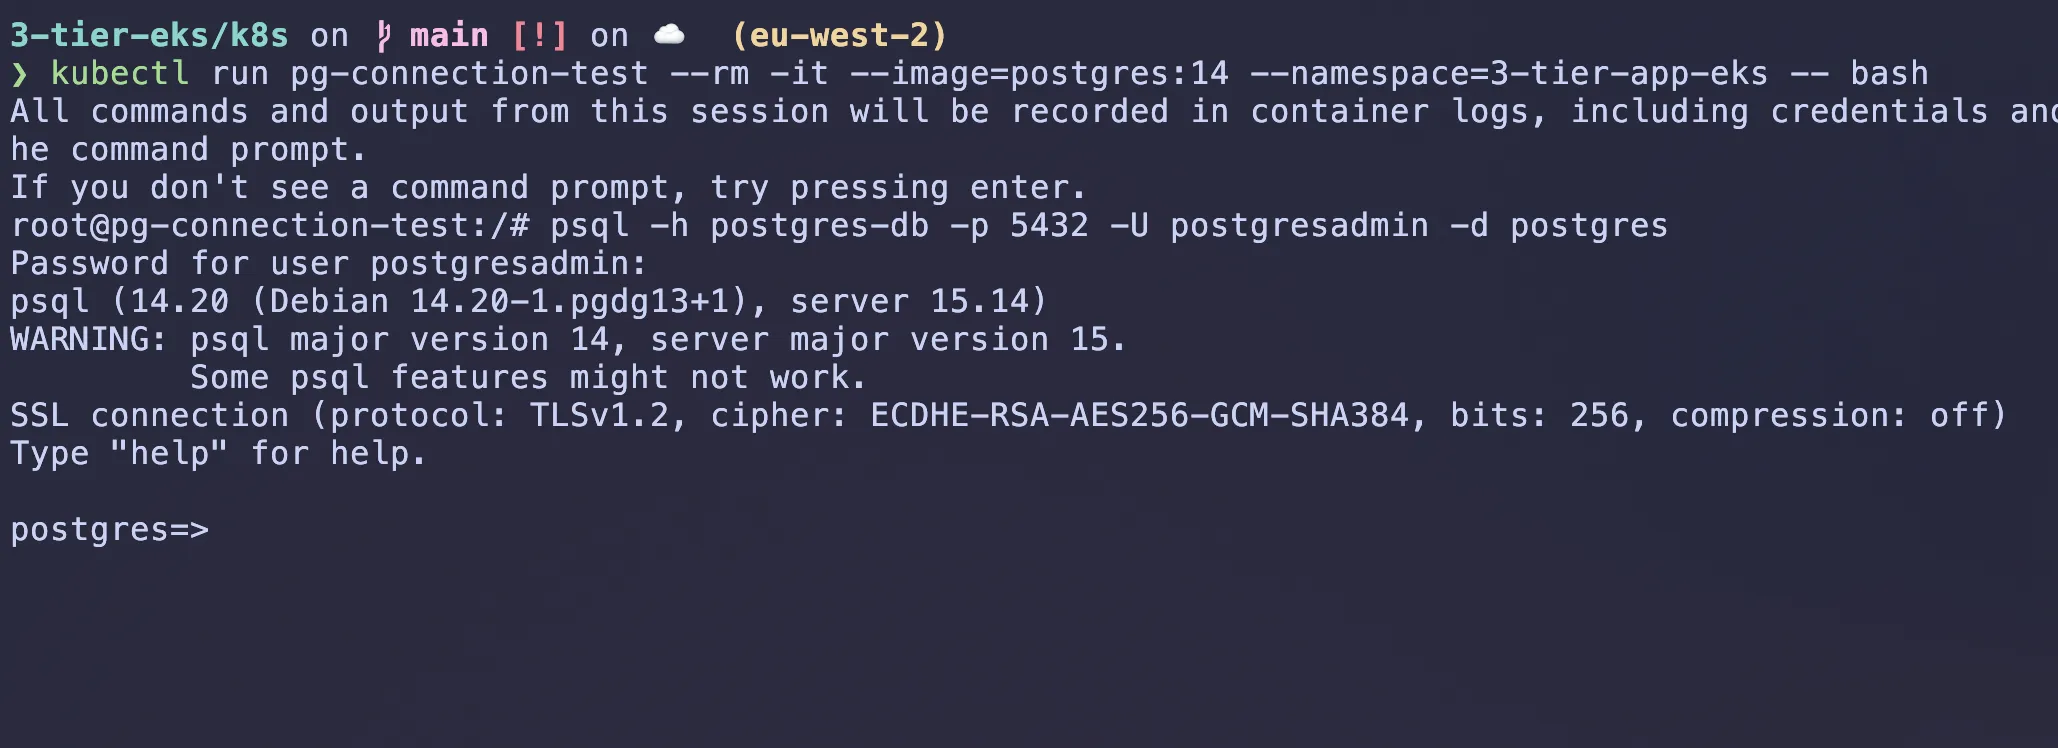
To test we can run a temporary pod in the same namespace and try to connect to the RDS instance using the DNS name:
kubectl run pg-connection-test --rm -it --image=postgres:14 --namespace=3-tier-app-eks -- bash
# Inside the pod, try to connect to the RDS instance
#the name postgresadmin is the username we set when creating the RDS instance change it to your username
psql -h postgres-db -p 5432 -U postgresadmin -d postgres
Itll ask for the password, enter the password you set when creating the RDS instance. If you see a prompt like postgres=#, then you have successfully connected to the RDS instance. Dont forget to exit the pod when done by typing exit and then exit again.
ExternalName Service Pattern
An ExternalName service in Kubernetes allows you to create a service that points to an external resource, such as an AWS RDS instance. This is useful for integrating external databases or services into your Kubernetes applications without needing to manage the lifecycle of those resources within Kubernetes. Benefits of ExternalName Service:
- Service Discovery: Applications connect via standard Kubernetes DNS
- Flexibility: Easy to switch between different RDS endpoints
- Abstraction: Decouples application from specific database endpoints
- Environment Consistency: Same service name across dev/staging/prod
Creating Kubernetes Secrets and configmaps for RDS details
Secrets are used to store sensitive information like database credentials, SSH keys while ConfigMaps are used to store non-sensitive configuration data. We will create a Kubernetes Secret for the RDS database credentials and a ConfigMap for the application configuration. Configmaps use key-value pairs to store non-sensitive data as environment variables, while secrets use base64 encoding to store sensitive data.
Instead of making a secrets.yaml we will use kubectl create generic command to create the secret, it helps avoid errors and ensures consistency. It will automatically base64 encode the values.
# Define your variables first or type them in the command
# This creates the secret object directly in Kubernetes
# leave DB_SECRET_KEY as default for now as this is a practice project
kubectl create secret generic db-secrets \
  --namespace 3-tier-app-eks \
  --from-literal=DB_USERNAME='postgresadmin' \
  --from-literal=DB_PASSWORD='your-secure-password' \
  --from-literal=DB_SECRET_KEY='your-secret-key' \
  --from-literal=DATABASE_URL='postgresql://<username>:<password>@<host>:5432/postgres'
# replace with username,password,host.
Keep secret key the same as in the backend app it defaults to dev-secret-key but you can change it to whatever you want. its better to generate a random secret key for production use, but for now lets leave as is.
The database url is postgresql://<your-rds-username>:<your-rds-password>@<host>:5432/postgres it encapsulates the username, password, host, port and database name. This is how the application will connect to the RDS database.
Now we will create a ConfigMap for the application configuration. This will store non-sensitive data like the application host and port.
apiVersion: v1
kind: ConfigMap
metadata:
  name: app-config
  namespace: 3-tier-app-eks
data:
  DB_HOST: "postgres-db.3-tier-app-eks.svc.cluster.local"
  DB_NAME: "postgres"
  DB_PORT: "5432"
  FLASK_DEBUG: "0"
Apply the config manifest:
kubectl apply -f configmap.yaml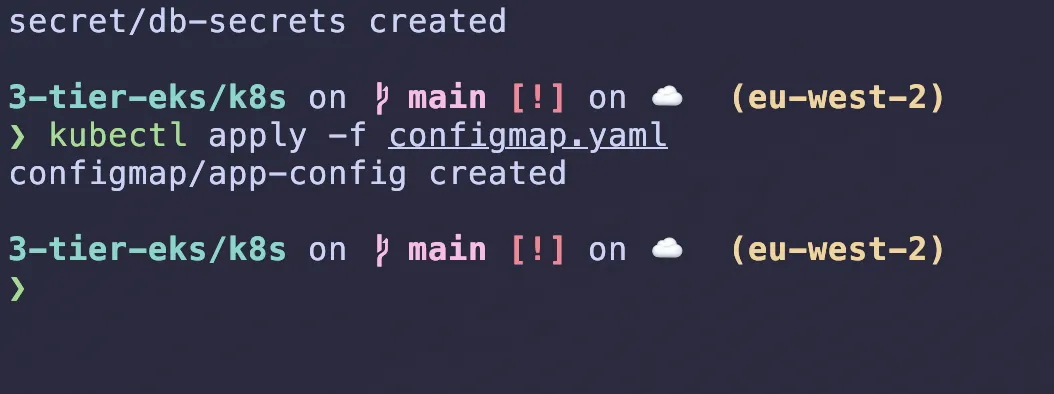
Running database migrations
In this project theres a database migration that needs to be run before deploying the backend service. This is done using a Kubernetes Job, which is a one-time task that runs to completion, this will create database tables and seed data for the application to work correctly.
What a job does is it creates a pod that runs the specified command and then exits. If the command fails, the job will retry until it succeeds or reaches the specified backoff limit.
This command kubectl apply -f migration_job.yaml will create a job that runs the command to apply the database migrations. This command will create the necessary tables and seed data in the RDS PostgreSQL database. Its worth analysing the job manifest to understand what it does and how it works. this is where the secrets and configmaps we created earlier will be used to connect to the database. its better than hardcoding the database credentials in the job manifest, because it allows you to change the credentials without modifying the job manifest.
(dont forget to modify the file to use your own backend image)
I actually got an error because my migration_job.yaml couldnt find DB_SECRET_KEY, however it was actually named SECRET_KEY

I debugged using kubectl describe pod database-migration-<name> -n 3-tier-app-eks
Get the database-migration-<name> through kubectl get pods -n 3-tier-app-eks
I deleted the secret we created above using kubectl delete secret db-secrets -n 3-tier-app-eks and the job using kubectl delete job database-migration -n 3-tier-app-eks.
I ran the command above with SECRET_KEY instead, as thats whats stated in the migration_job.yaml file and then ran kubectl apply -f migration_job.yaml
#run these one by one
kubectl apply -f migration_job.yaml
kubectl get job -A
kubectl get pods -n 3-tier-app-eks
Run kubectl describe pod database-migration-<name> -n 3-tier-app-eks and you should see it completed succesfully
Backend and Frontend services
Now lets deploy the backend and frontend services. The backend service is a Flask application that connects to the RDS PostgreSQL database, and the frontend service is a React application that communicates with the backend service.
Read the manifest files for the backend and frontend services to understand what they do and how they work. The backend service will use the secrets and configmaps we created earlier to connect to the database and configure the application. The frontend service will use the backend service’s URL to communicate with it.
# apply the backend service manifest
kubectl apply -f backend.yaml
# apply the frontend service manifest
kubectl apply -f frontend.yaml
# check the status of the pods
kubectl get deployment -n 3-tier-app-eks
kubectl get svc -n 3-tier-app-eks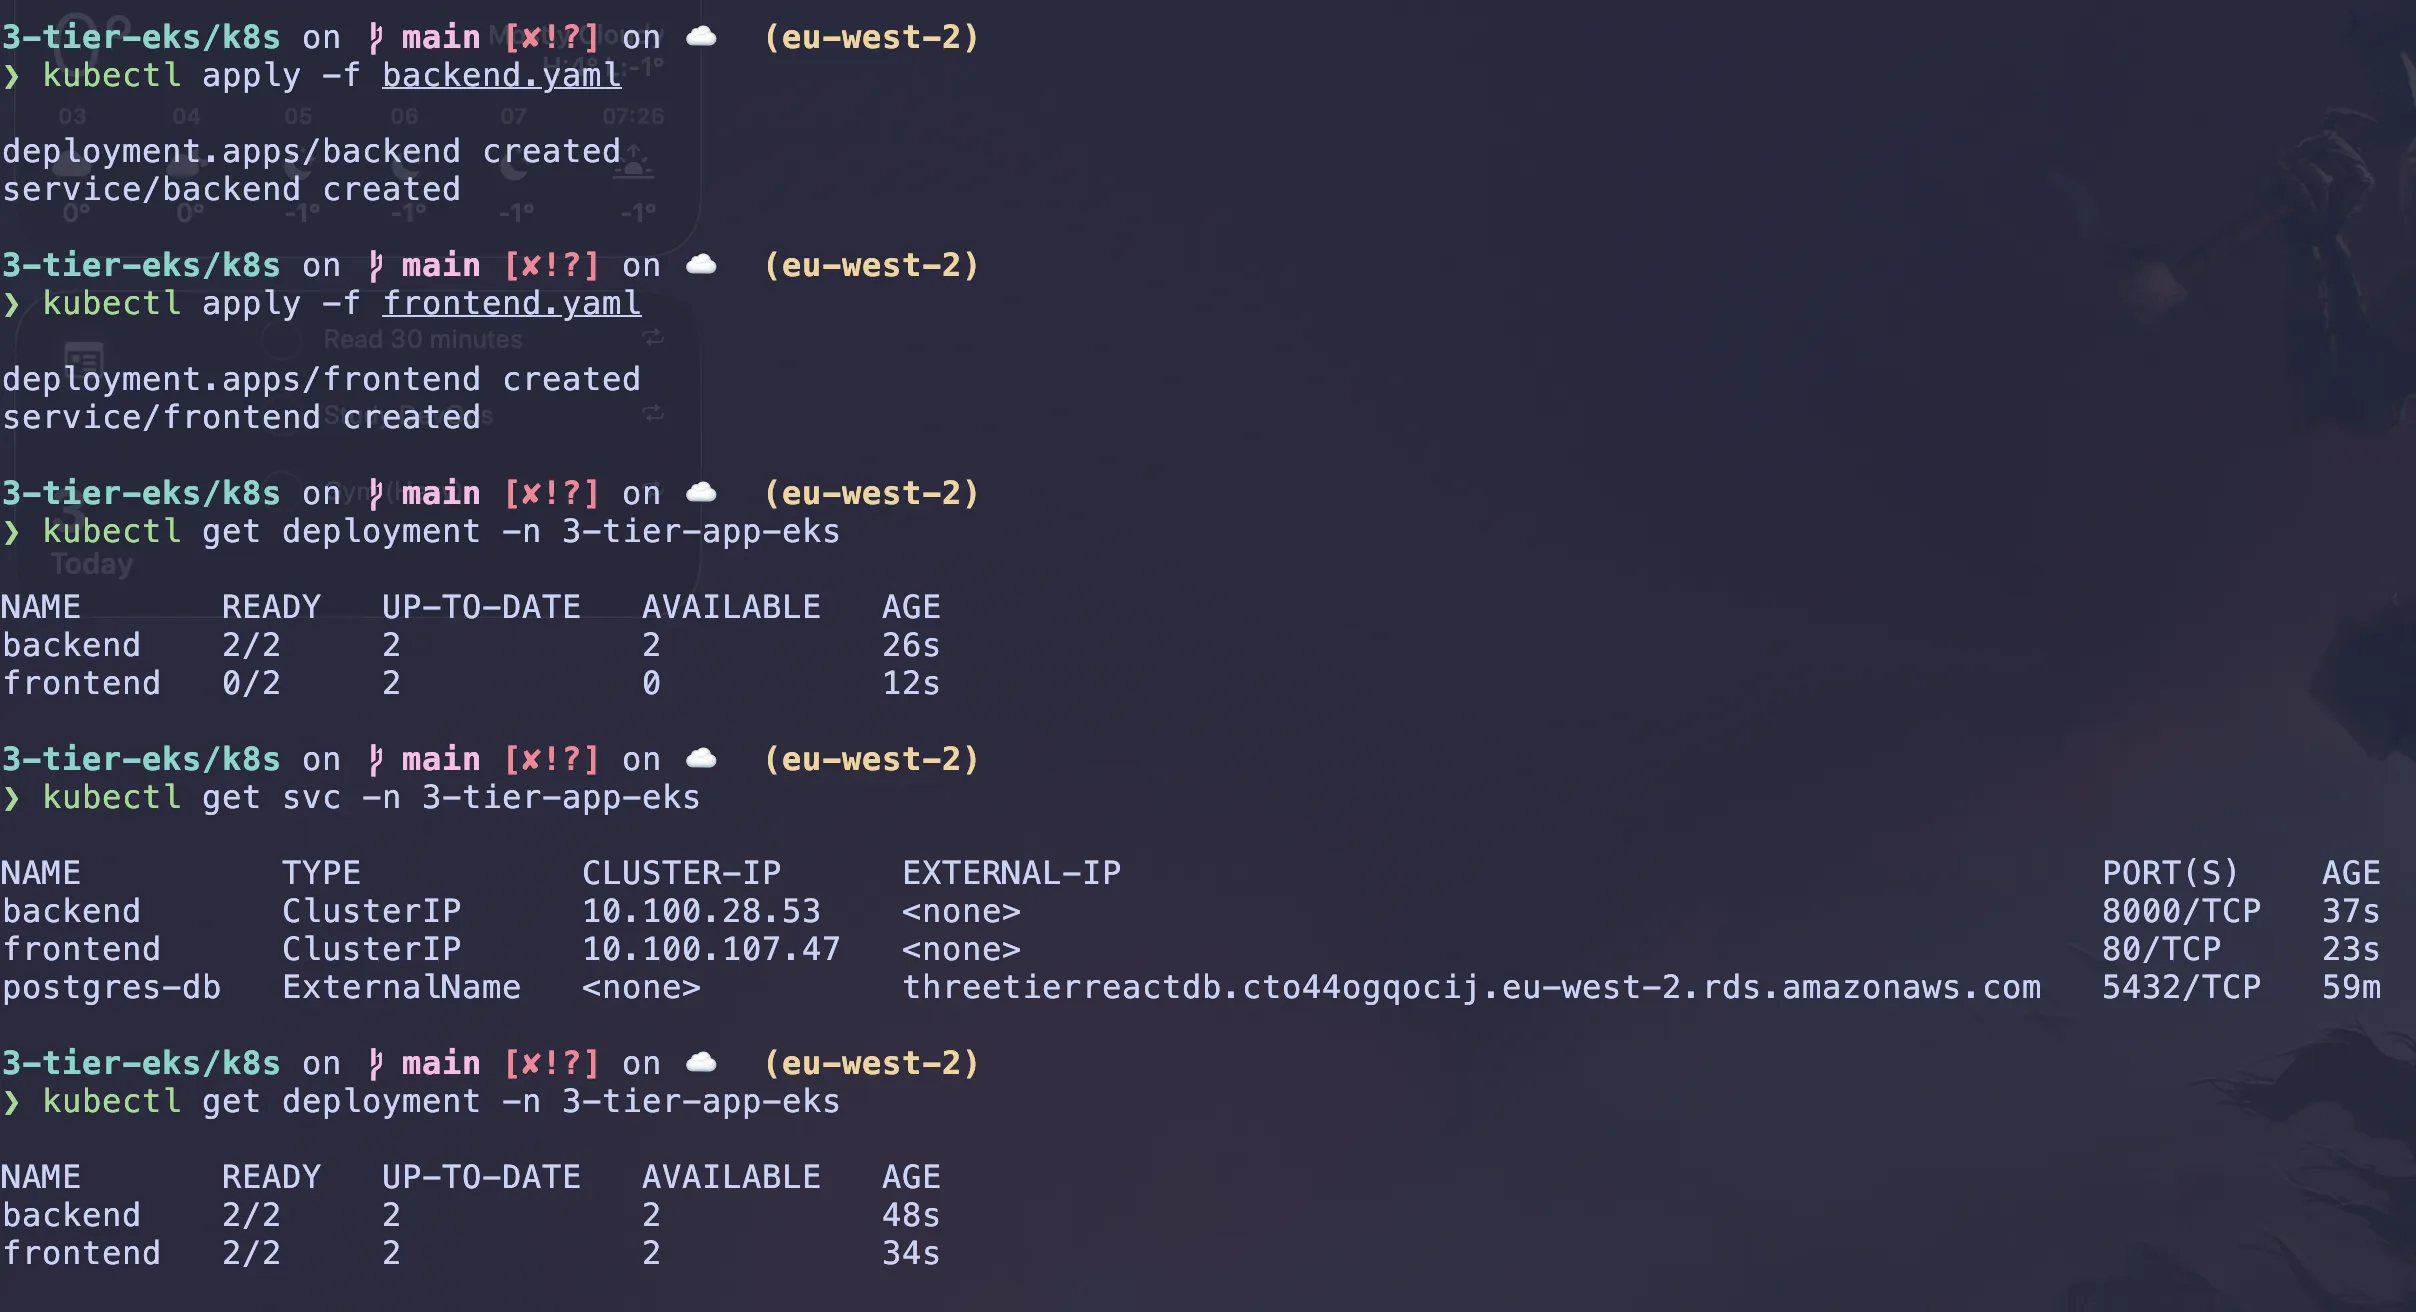
Accessing the application
At the minute we havent created ingress resources to expose the application to the internet. To access the application temporarily, we will port-forward the frontend and backend services to our local machine. This will allow us to access the application using localhost and a specific port. Open two terminal windows, one for the backend service and one for the frontend service. In the first terminal window, run the following command to port-forward the backend service: We need to open new terminals because the port-forward command will block the terminal until you stop it with CTRL+C.
# port-forward the backend service to localhost:8000
kubectl port-forward svc/backend 8000:8000 -n 3-tier-app-eks
# port-forward the frontend service to localhost:8080
kubectl port-forward svc/frontend 8080:80 -n 3-tier-app-eks
you can access the backend service at http://localhost:8000/api/topics in the browser or curl http://localhost:8000/api/topics in the terminal.
you can access the frontend service at http://localhost:8080 in the browser. The frontend service will communicate with the backend service to fetch data and display it.

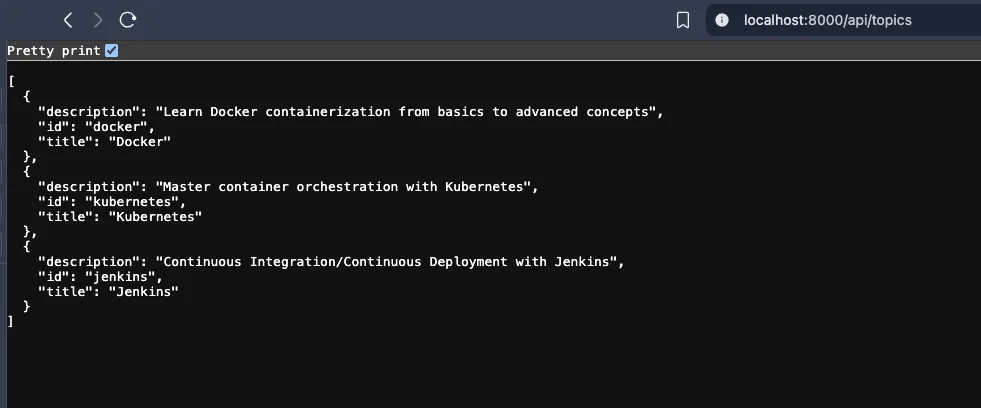
this is a devops quiz application that you can use. the seed data created some samples, in the manage questions you can add more questions and answers. the 3-tier-app-eks/backend/questions-answers includes some csv files that you can use to import questions and answers into the application. You can also add your own questions and answers using the frontend interface.
Time to implement Ingress
An ingress is a Kubernetes resource that manages external access to services in a cluster, typically via HTTP/HTTPS. It provides load balancing, SSL termination and name-based virtual hosting.
We need to install the AWS Load Balancer Controller. This is a pod that runs in our cluster and ‘listens’ for Ingress resources. When it sees one, it automatically provisions an AWS ALB.
Installing the AWS Load Balancer Controller using Helm
Kubernetes Itself Doesn’t Know About AWS Load Balancers
Kubernetes doesn’t natively know how to create AWS ALBs or NLBs. It only understands generic concepts like:Service of type LoadBalancer or Ingress
# install helm if haven't already
brew install helm # (for mac, check for other platforms)

# Add the EKS Helm chart repository. If you tried to install the AWS Load Balancer Controller manually, you'd need to apply dozens of YAML files in the correct order:
helm repo add eks https://aws.github.io/eks-charts
helm repo update

# what this does is it installs the AWS Load Balancer Controller in the kube-system namespace,
# This allows the controller to manage load balancers in your cluster and automatically create them for your services.
helm install aws-load-balancer-controller eks/aws-load-balancer-controller \
  -n kube-system \
  --set clusterName=$CLUSTER_NAME \
  --set serviceAccount.create=true \
  --set serviceAccount.name=aws-load-balancer-controller
Helm is the package manager for Kubernetes. Think of it like:
apt or yum for Linux, or pip for Python.
But instead of installing OS packages or libraries, Helm installs Kubernetes applications (which are usually a big set of YAML files, configs, CRDs, etc).
Why Use Helm Here?
Doing this manually would be dozens of kubectl apply -f commands with templated YAML. Helm bundles all that up into a reusable chart.
The eks/aws-load-balancer-controller chart contains:
aws-load-balancer-controller/
├── Chart.yaml                    # Chart metadata
├── values.yaml                   # Default configuration
├── templates/
│   ├── deployment.yaml           # Controller pods
│   ├── serviceaccount.yaml       # (Optional - we skip this)
│   ├── clusterrole.yaml          # Kubernetes permissions
│   ├── clusterrolebinding.yaml   # Link SA to permissions
│   ├── configmap.yaml            # Configuration data
│   ├── service.yaml              # Internal service
│   └── webhooks.yaml             # Admission controllers
└── README.md                     # Installation docs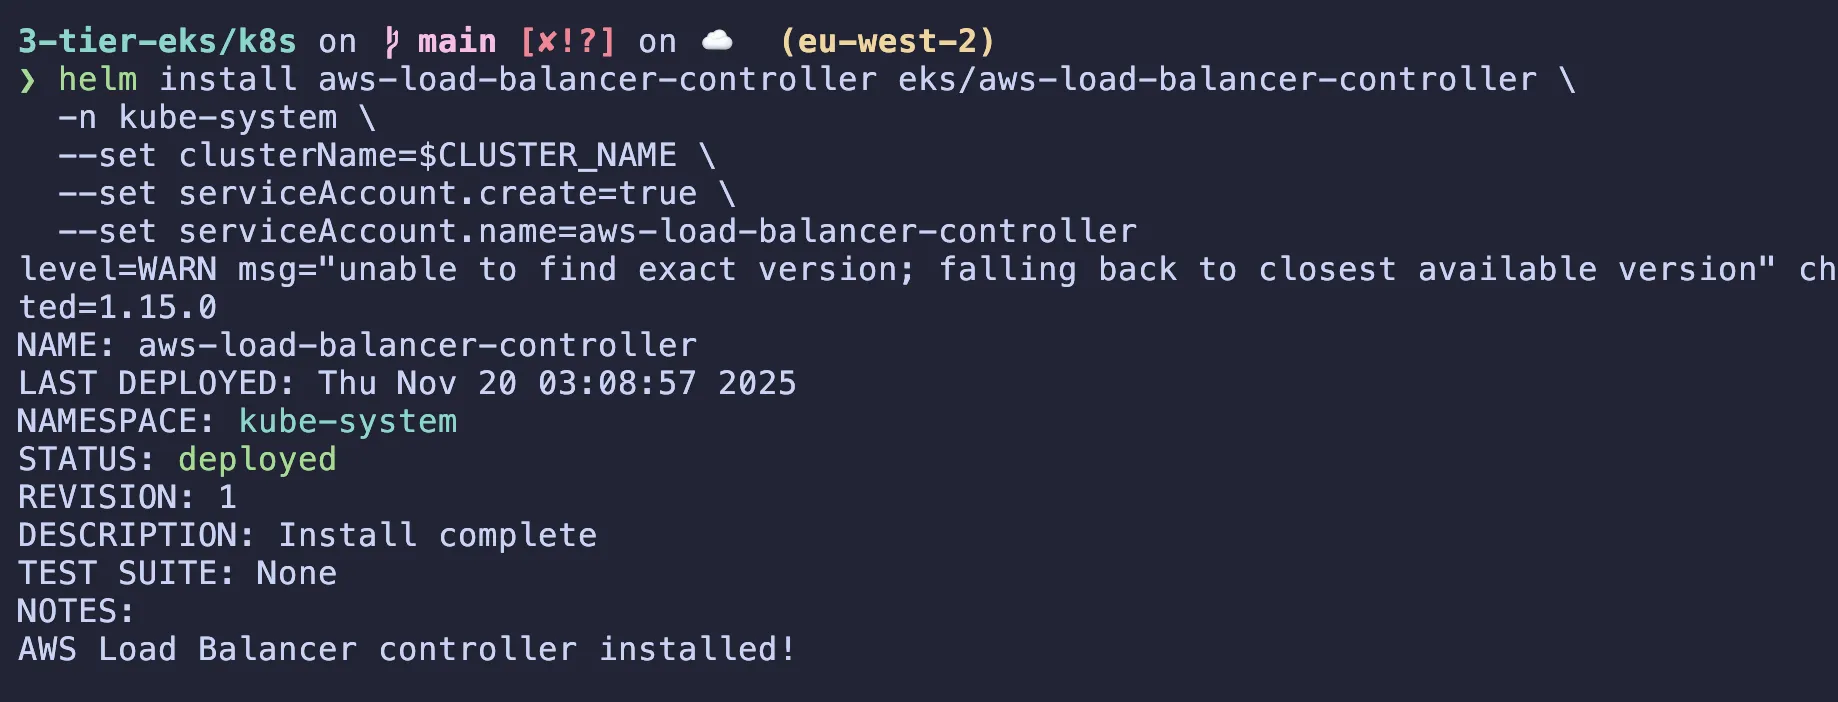
Ingress manifest to access the frontend service
Now to apply the ingress manifest using kubectl apply -f ingress.yaml.
The Ingress Class is the link that tells Kubernetes who should execute your orders. It identifies the specific Ingress Controller (the software) that should manage this Ingress. By setting ingressClassName: alb, you are explicitly saying: “This set of rules is for the AWS Load Balancer Controller. Please provision an ALB for me.”
The Ingress resource is just a configuration file. It defines what you want to happen, but it doesn’t actually do anything itself. It simply lists routing rules.
If a user goes to my-app.com/api, send them to the backend service.
apiVersion: networking.k8s.io/v1
kind: IngressClass
metadata:
  name: alb
spec:
  controller: ingress.k8s.aws/alb
---
apiVersion: networking.k8s.io/v1
kind: Ingress
metadata:
  name: three-tier-ingress
  namespace: 3-tier-app-eks
  annotations:
    # 1. Make the Load Balancer public
    alb.ingress.kubernetes.io/scheme: internet-facing
    # 2. Route traffic directly to Pod IPs (Faster & required for Fargate)
    alb.ingress.kubernetes.io/target-type: ip
    # 3. (Optional) Explicit health check path if your apps don't respond to '/'
    # alb.ingress.kubernetes.io/healthcheck-path: /
spec:
  ingressClassName: alb
  rules:
    - http:
        paths:
          # Specific paths must come FIRST
          - path: /api
            pathType: Prefix
            backend:
              service:
                name: backend
                port:
                  number: 8000
          # The "Catch-All" path comes LAST
          - path: /
            pathType: Prefix
            backend:
              service:
                name: frontend
                port:
                  number: 80
# Check the ingress and load balancer controller logs
kubectl get ingress -n 3-tier-app-eks
kubectl describe ingress 3-tier-app-ingress -n 3-tier-app-eks
# After ingress creation if you have issues you can check the logs
kubectl logs -n kube-system -l app.kubernetes.io/name=aws-load-balancer-controller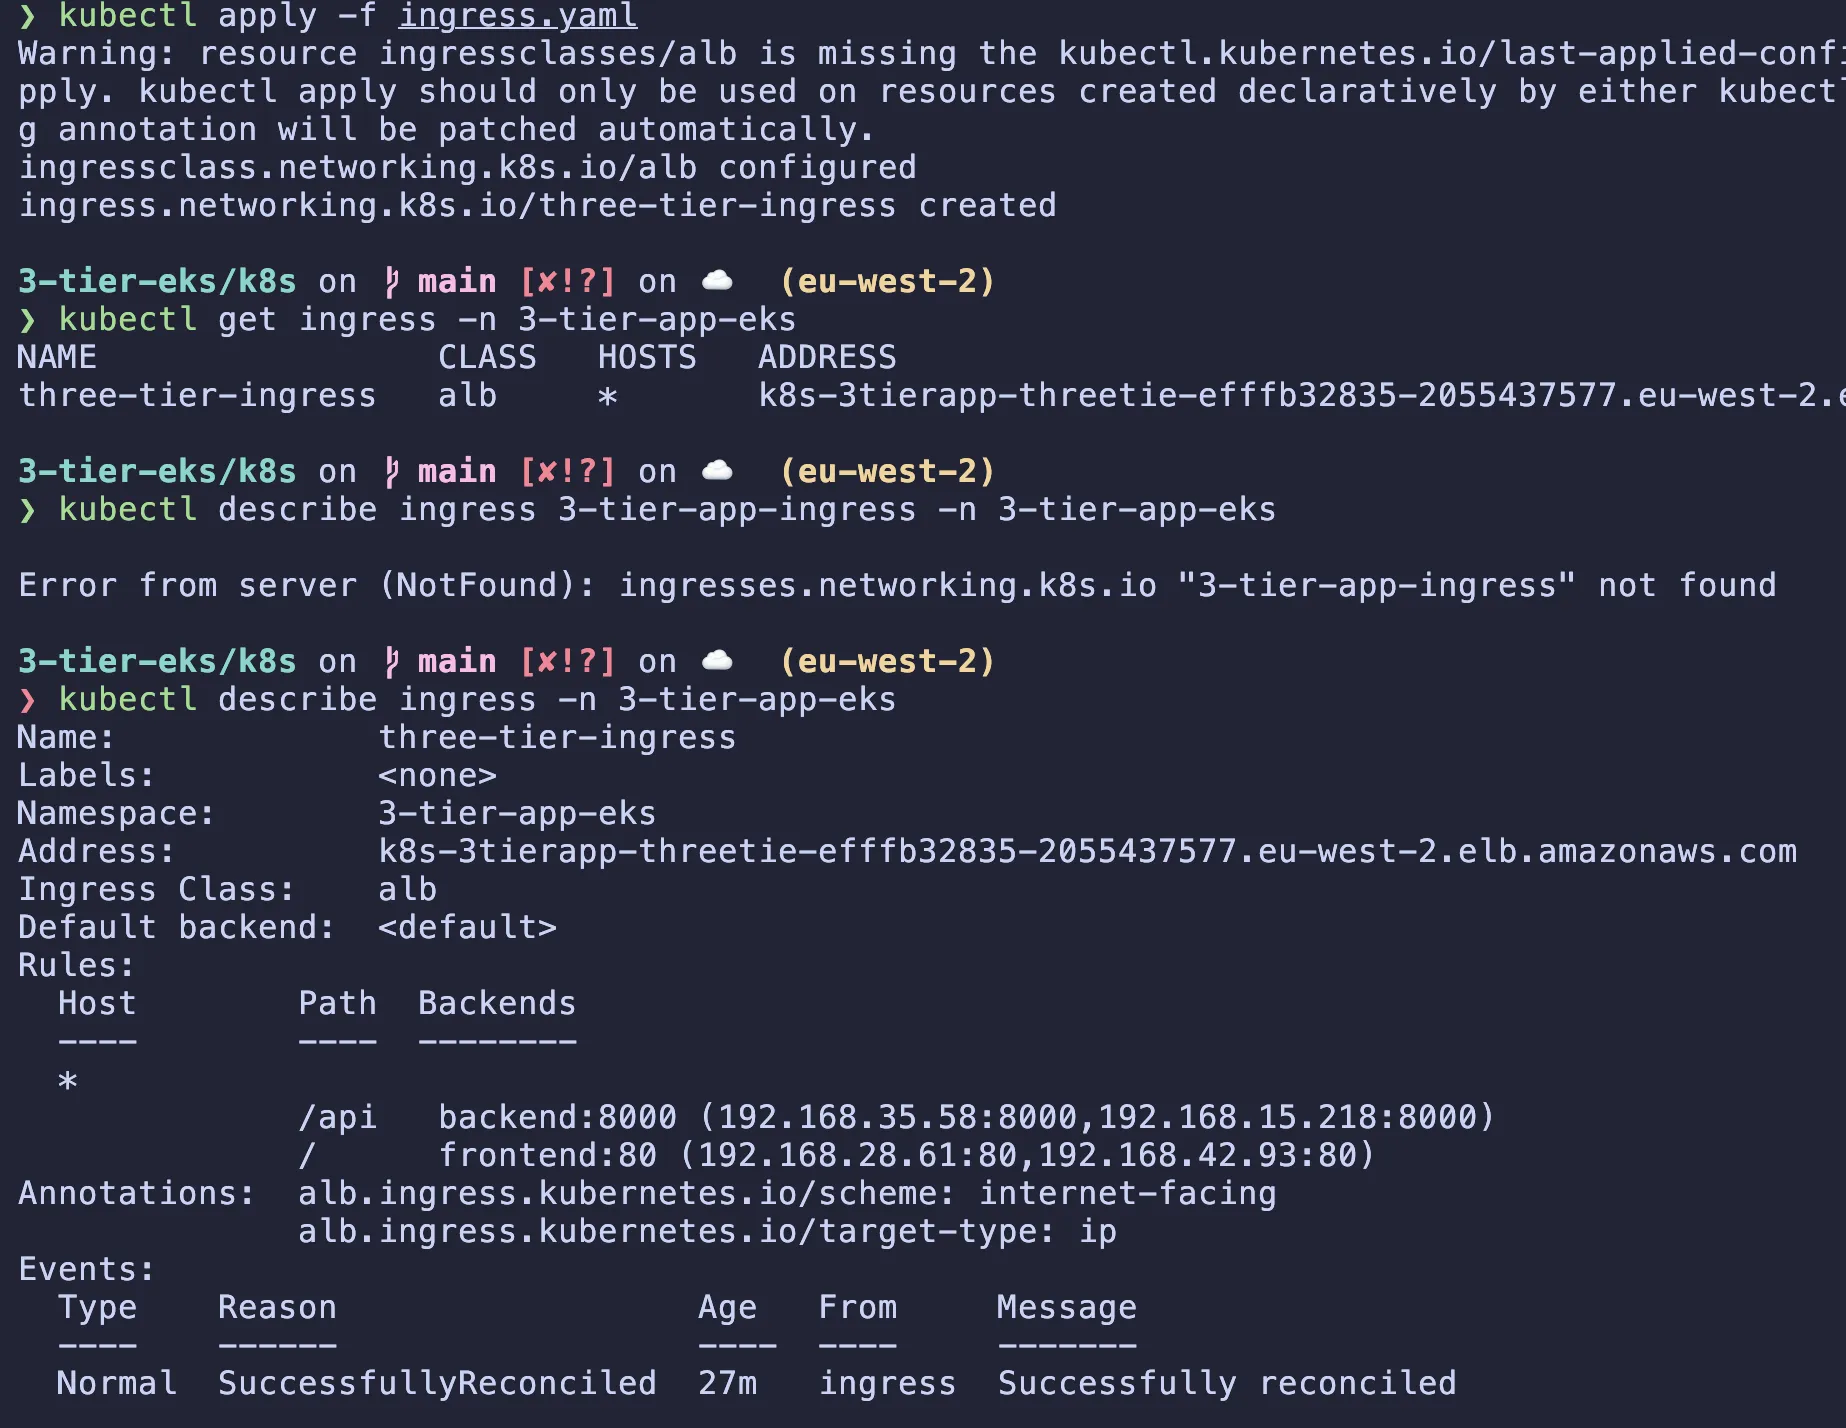
It may take a few minutes for the ALB to be provisioned and the DNS name to be available. Once it is available, you can access it by copying the DNS name from the ingress command and pasting it in the browser.
Here’s a video demo: (best in full screen)
Complete CI/CD using ArgoCD (GitOps)
Implementing ArgoCD is a crucial step in ensuring that your application is continuously deployed and updated. ArgoCD provides a declarative way to manage your Kubernetes applications and ensures that they are always in the desired state. It helps us stop running kubectl apply -f ... if there are any changes in the configuration. It will watch our repositeory on push and sync changes automatically.
First lets create a seperate namespace for ArgoCD
kubectl create namespace argocdNext, we will get the ArgoCD manifests from their GitHub repository.
kubectl apply -n argocd -f https://raw.githubusercontent.com/argoproj/argo-cd/stable/manifests/install.yaml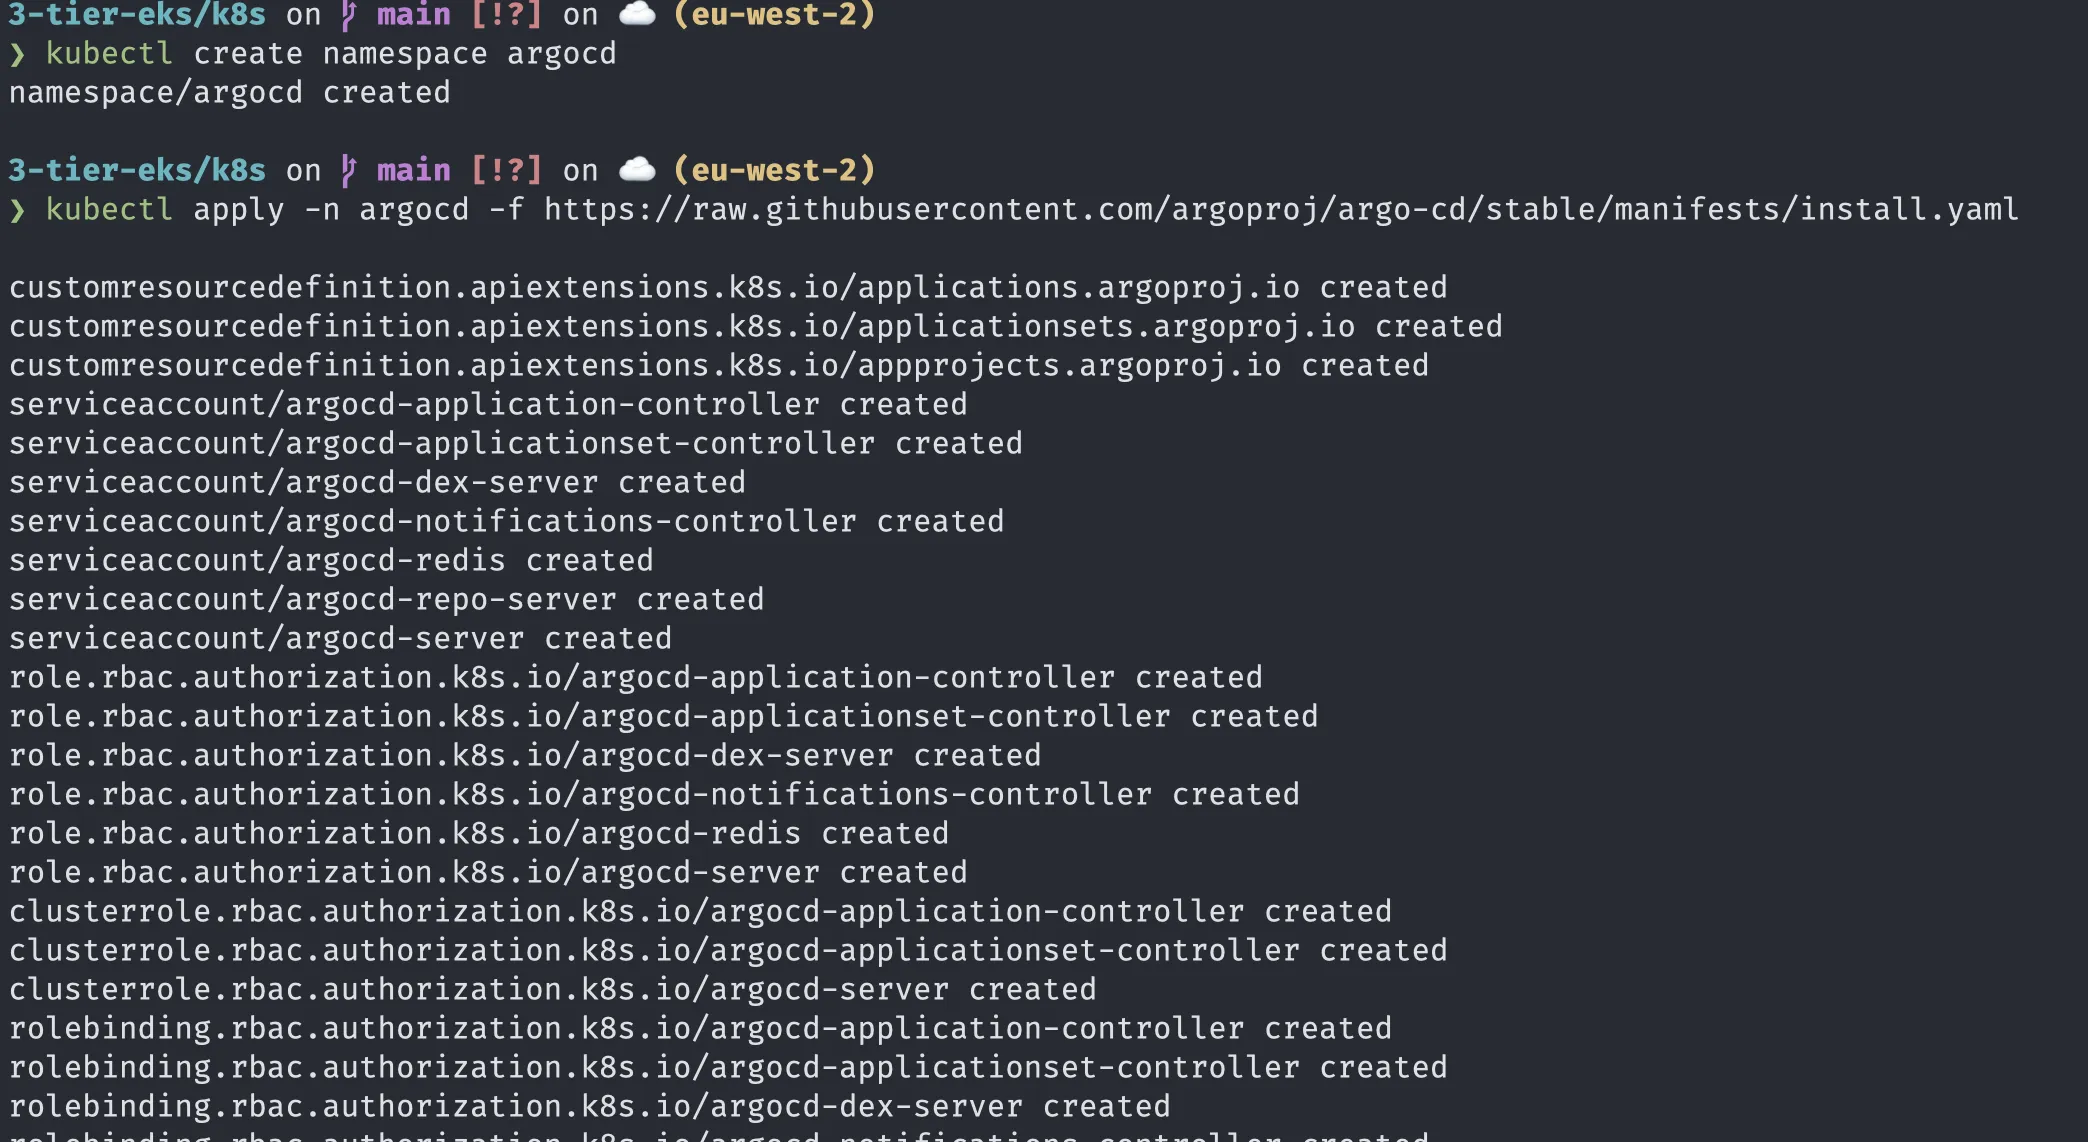
Now lets access the ArgoCD UI using port forwarding: (we could create a loadbalancer but its not needed right now)
kubectl port-forward svc/argocd-server -n argocd 9000:443You may get a warning about the certificate being self-signed. This is expected as we are using a self-signed certificate for the ArgoCD server. You can ignore this warning and proceed to the UI by pressing advanced and proceed
Now to sign in the username is admin and the password you can retrieve from
kubectl -n argocd get secret argocd-initial-admin-secret -o jsonpath="{.data.password}" | base64 -d; echo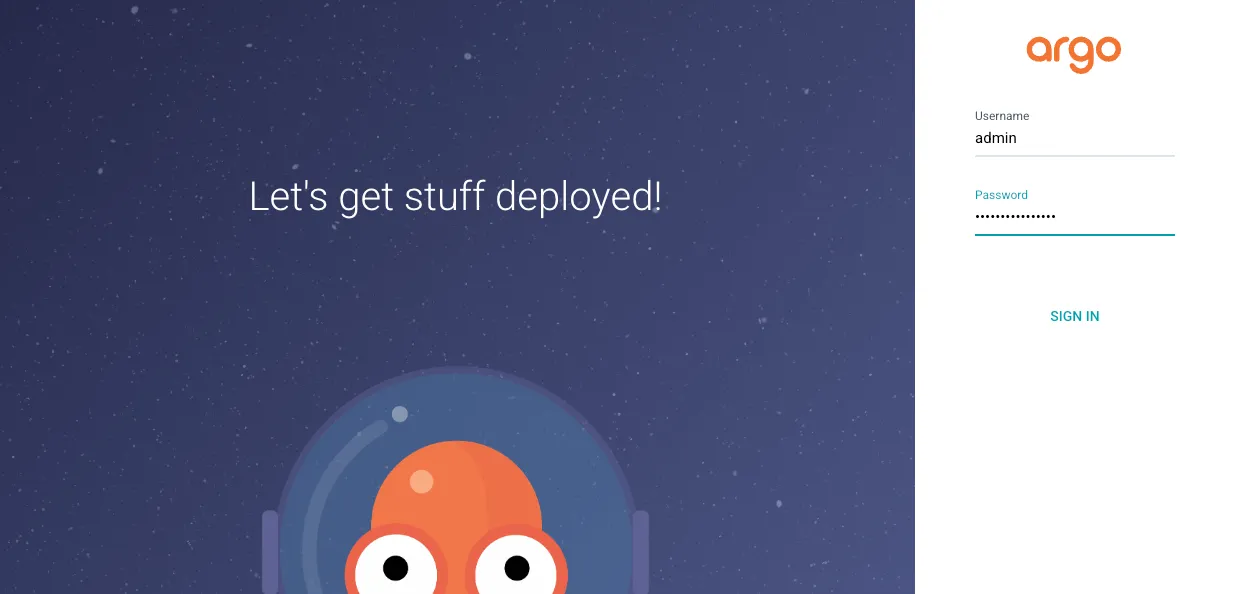
Now we need to get ArgoCD to manage our application. We will use ‘Application’ as code rather than doing it manually on ArgoCD. We will use the argocd-app.yaml in our repository:
apiVersion: argoproj.io/v1alpha1
kind: Application
metadata:
  name: three-tier-app
  namespace: argocd
spec:
  project: default
  source:
    # 1. Point to your GitHub repository
    repoURL: https://github.com/wegoagain-dev/3-tier-eks.git
    # 2. Point to the folder containing your Kubernetes manifests
    path: k8s
    # 3. The branch to watch
    targetRevision: main
  destination:
    # 4. Deploy to the same cluster ArgoCD is running in
    server: https://kubernetes.default.svc
    # 5. The namespace where your app should live
    namespace: 3-tier-app-eks

  # 6. Sync Policy (The "Magic")
  syncPolicy:
    automated:
      prune: true    # Delete resources in K8s if they are removed from Git
      selfHeal: true # Fix resources in K8s if someone manually changes them
    syncOptions:
      - CreateNamespace=true # Automatically create the '3-tier-app-eks' namespace (useful if we didnt have it before)
Now lets apply using kubectl apply -f argocd-app.yaml
ArgoCD will sync everything else (backend.yaml, frontend.yaml, ingress.yaml) from GitHub.
Now lets go back to the Argo UI and click the three-tier-app card. You should see green status. as it is synced. Lets ignore the database-migration as we have ran it already and db-secrets as we have created them in a different way.
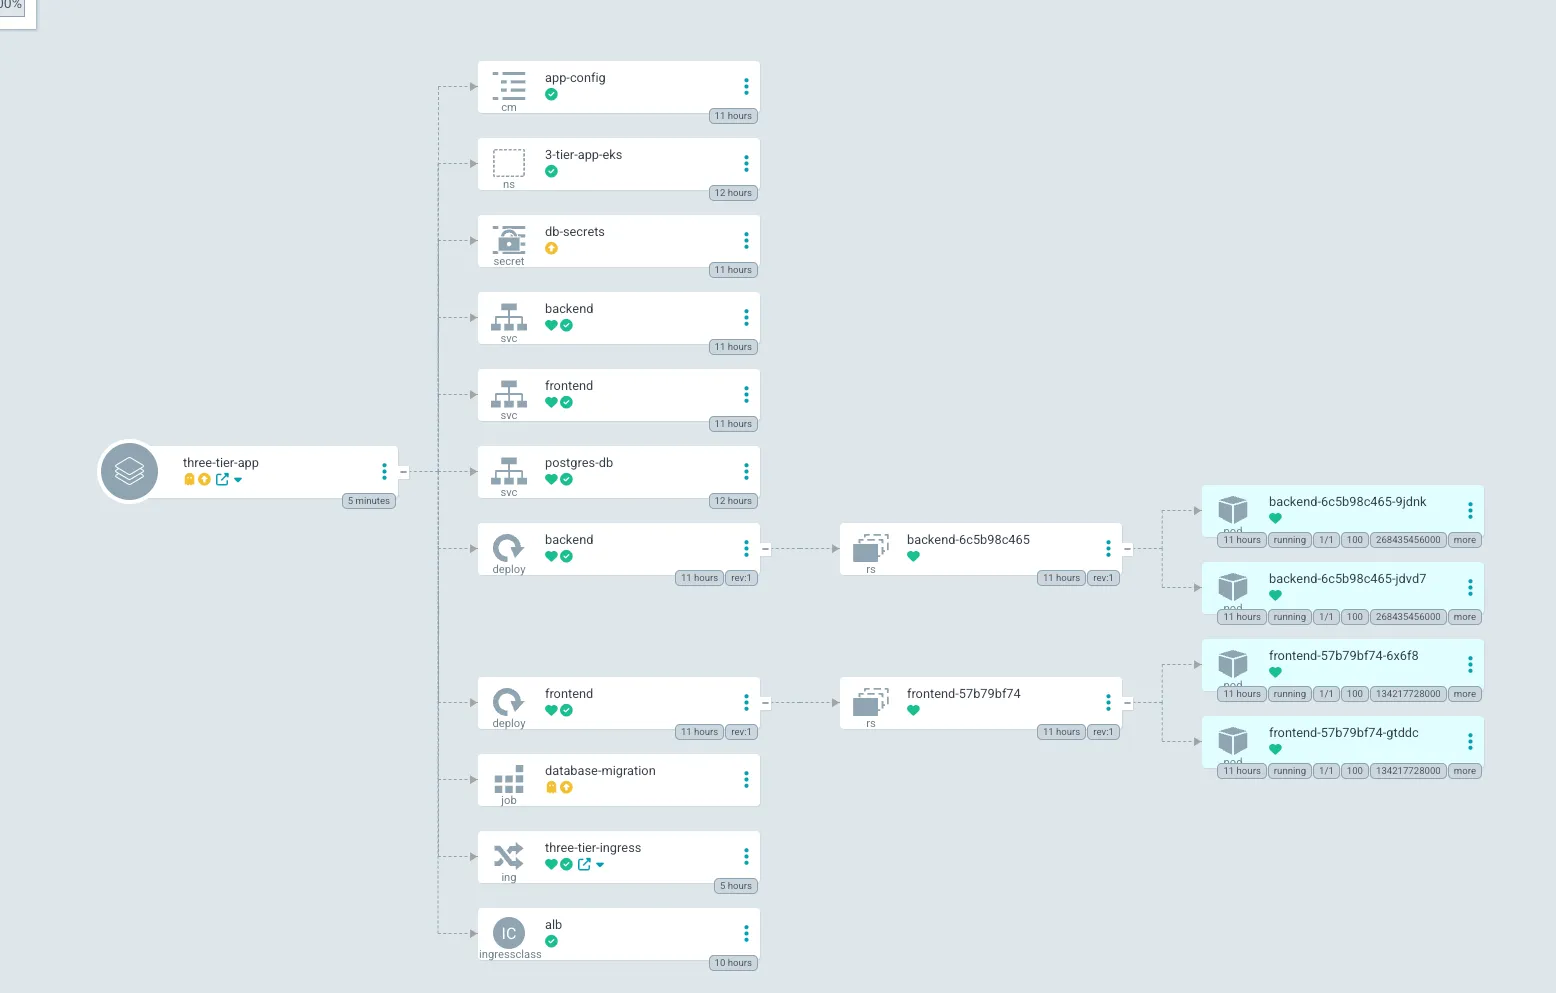
Let’s test the GitOps Flow:
- Change the replicas: 2 in your backend.yaml to replicas: 3.
- Commit and push to GitHub.
- Watch ArgoCD automatically detect the change and spin up a new pod without you touching kubectl. (wait a few minutes)
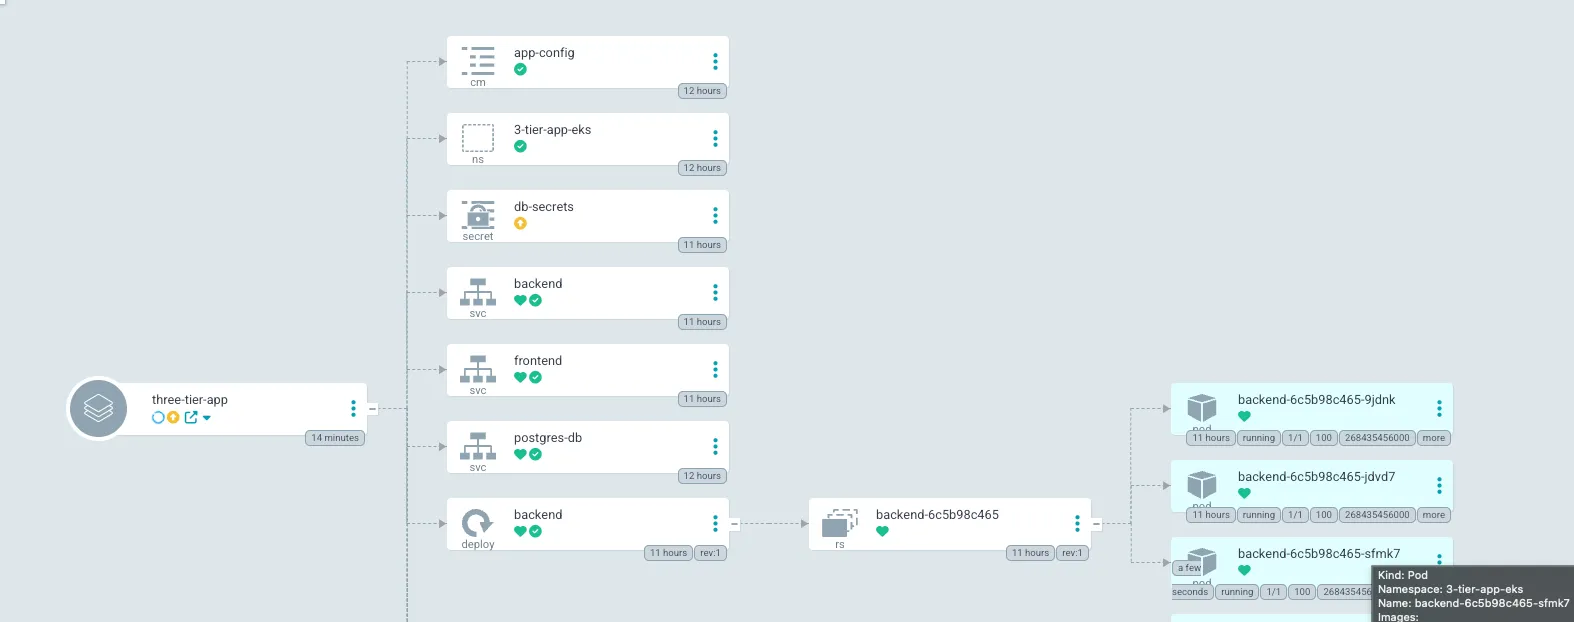
We now have a working application with GitOps and CI/CD.
Adding Monitoring and Logging (Prometheus and Grafana)
First lets seperate this by creating a new namespace for monitoring and logging.
kubectl create namespace monitoringWe will use helm to install Prometheus and Grafana.
# were just adding the chart repository and making sure its up to date
helm repo add prometheus-community https://prometheus-community.github.io/helm-charts
helm repo update
# this is what will install prometheus and grafana and a few other tools needed. installing it in the monitoring namespace, scrape all servicemonitors in cluster, and set password to access the grafana dashboard(in prod: itll ususally be a Kubernetes secret)
helm install prometheus prometheus-community/kube-prometheus-stack \
  --namespace monitoring \
  --set prometheus.prometheusSpec.serviceMonitorSelectorNilUsesHelmValues=false \
  --set grafana.adminPassword='admin123'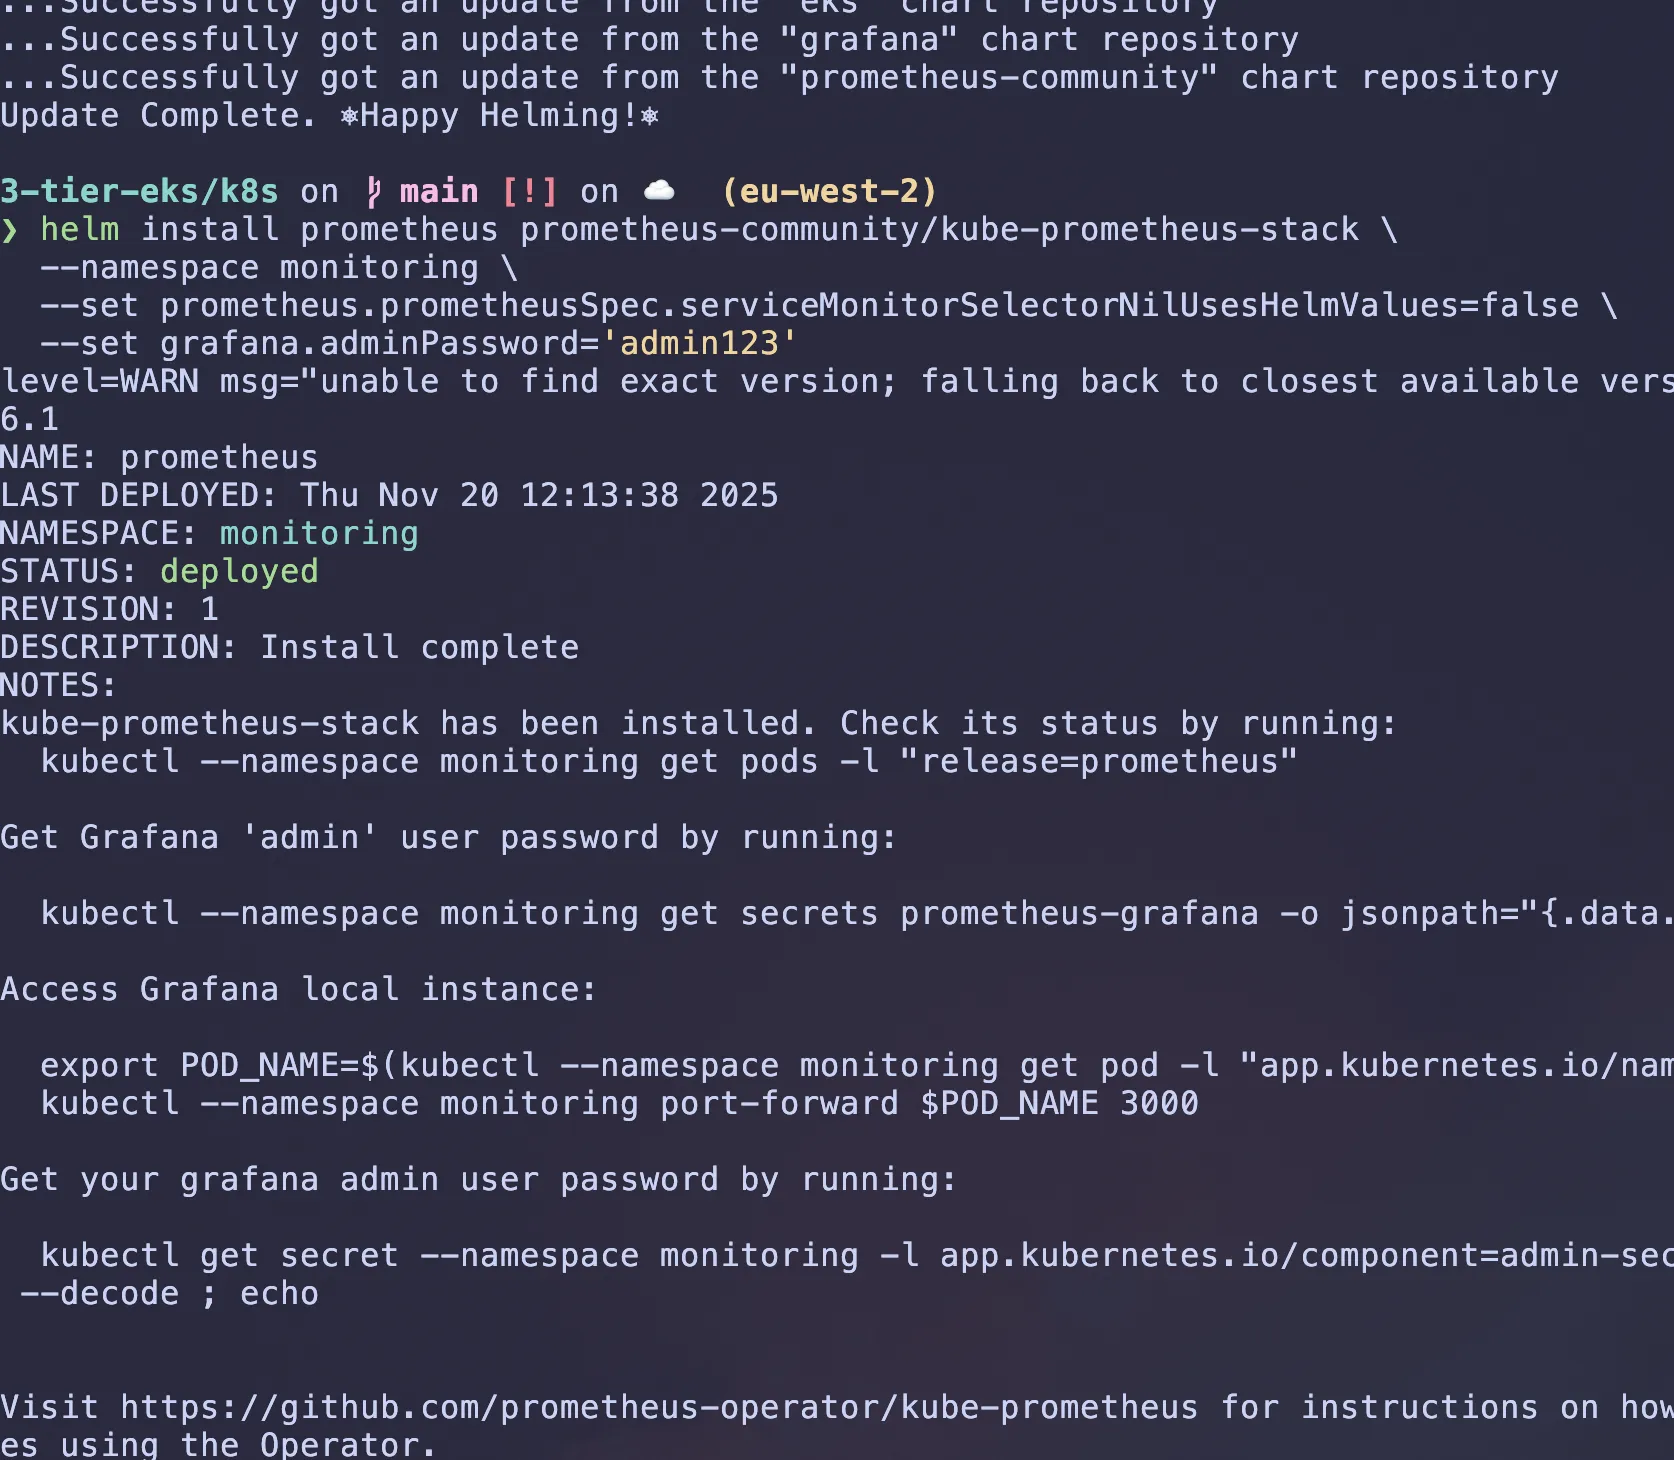
Give it a bit of time then check pods are running using kubectl get pods -n monitoring

Accessing Grafana Dashboard
To access the Grafana dashboard, we first need to port-forward as the service is running private network within Kubernetes cluster. By default, it has no public IP address, so we can’t just “visit” it from the internet:
kubectl port-forward svc/prometheus-grafana -n monitoring 3000:80Then open your browser and navigate to http://localhost:3000. You can login using the username admin and password admin123.
The best thing here is that there are preconfigured dashboards. Go to Dashboard and select the below as some examples:
-
“Kubernetes / Compute Resources / Namespace (Pods)”
- Select namespace:
3-tier-app-eks - See your frontend & backend CPU/Memory usage
- Select namespace:
-
“Kubernetes / Compute Resources / Cluster”
- Overall cluster health
- Shows you’re monitoring like a pro
-
“Node Exporter / Nodes”
- Detailed node metrics
- Disk, network, CPU per node
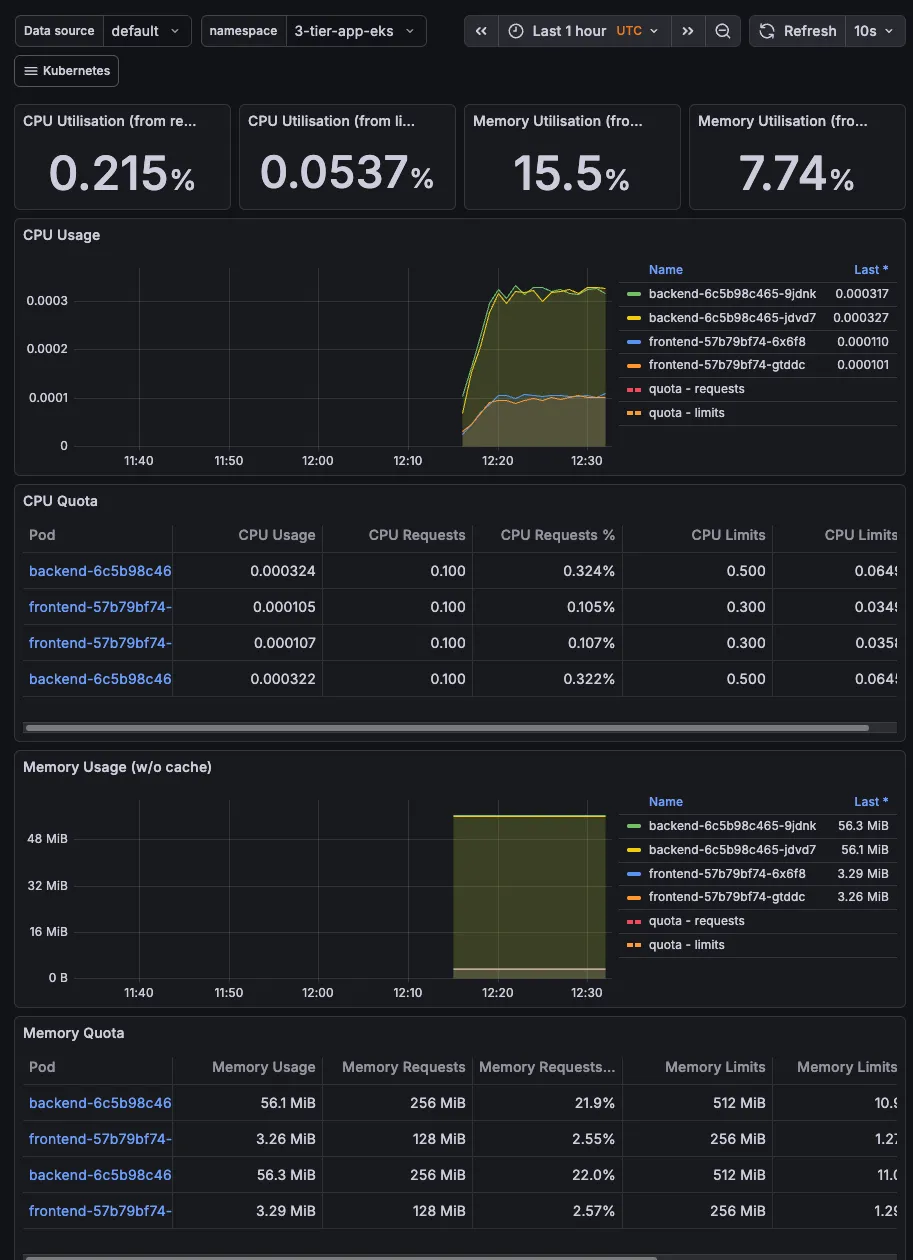
We could also expose the monitoring dashboard to the ALB so that we can access it from anywhere.
What’s next and how can we improve?
We will also use Route53 to create a custom domain for the application and point it to the ALB. This will allow us to access the application using a custom domain name instead of the ALB DNS name.
Security: Implementing Network Policies
Create Kubernetes NetworkPolicies to lock down traffic.
Frontend: Can only be accessed by the Ingress Controller.
Backend: Can only be accessed by the Frontend (deny all other traffic).
Database: Can only be accessed by the Backend.
Scaling: Add Horizontal Pod Autoscaling
Better Secret Management: External Secrets Operators
Delete the cluster and all resources created
To delete the RDS instance, you can use the following command:
#can take a while to delete
aws rds delete-db-instance \
--db-instance-identifier $DB_NAME \
--skip-final-snapshot \
--region $REGION

aws rds delete-db-subnet-group \
  --db-subnet-group-name $DB_SUBNET_GROUP_NAME \
  --region $REGION
To delete the EKS cluster and all resources created, you can use the following command:
eksctl delete cluster $CLUSTER_NAME --region $REGIONThis will delete the EKS cluster, the VPC, the RDS instance, and all other resources created during the setup. Make sure to back up any data you want to keep before running this command, as it will permanently delete all resources associated with the cluster.
Double check the AWS console to ensure all resources are deleted, as sometimes some resources may not be deleted automatically due to dependencies or other issues.
